
Fig. 3.
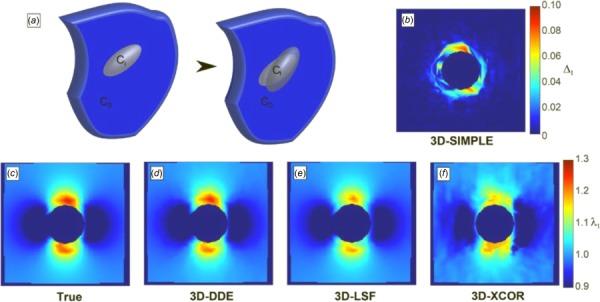
Principal stretch ratio estimations around image volumes of a contracting Eshelby inclusion, generated in silico. (a) Schematic of the Eshelby problem. (b) 3D-SIMPLE detected strain elevation surrounding the inclusion. (c) True values of the stretch ratio in the z-direction matched (d) the 3D-DDE estimated values, while (e) 3D-LSF and (f) 3D-XCOR estimates were successively worse.