FIGURE 1.
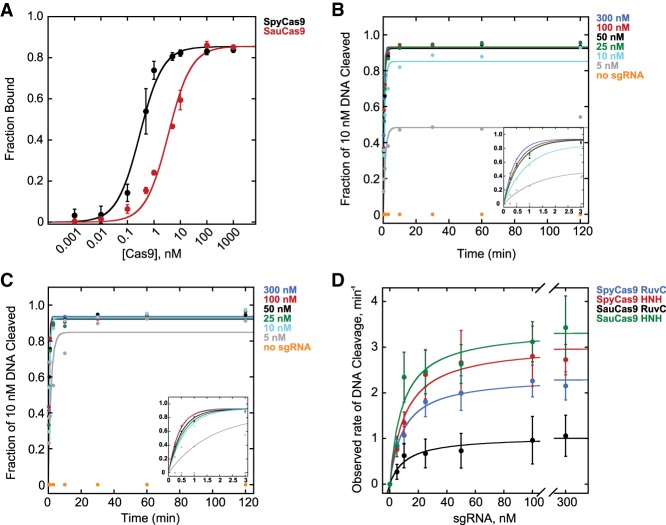
S. pyogenes and S. aureus Cas9 tightly bind their respective sgRNAs and form active RNPs. (A) Fraction bound of 50 pM 5′-32P-labeled sgRNA versus concentration of unlabeled SpyCas9 (black) or SauCas9 (red), resolved on a 6% native TBE acrylamide gel in the cold room. The KD values for SpyCas9 and SauCas9 were 0.29 ± 0.08 nM (R2 = 0.99) and 3.4 ± 0.2 nM (R2 = 0.99), respectively. (B–C) Representative plots showing observed rates (kobs) of HNH domain-catalyzed hydrolysis of 10 nM 110mer DNA by 25 nM (B) SpyCas9 and (C) SauCas9 in the presence of 300 nM (blue), 100 nM (red), 50 nM (black), 25 nM (green), 10 nM (cyan), 5 nM (gray), or no sgRNA (orange). Insets feature early time points of the respective plots for clarity. (D) Dependence of kobs on sgRNA concentration for SpyCas9 and SauCas9. (Blue) SpyCas9 RuvC domain-catalyzed cleavage: kmax = 2.3 ± 0.4 min−1, K1/2 = 8 ± 1 nM (R2 = 0.99); (red) SpyCas9 HNH domain-catalyzed cleavage: kmax = 3.0 ± 0.6 min−1, K1/2 = 9 ± 1 nM (R2 = 0.97); (black) SauCas9 RuvC domain-catalyzed cleavage: kmax = 1.0 ± 0.5 min−1, K1/2 = 10 ± 1 nM (R2 = 0.95); (green) SauCas9 HNH domain-catalyzed cleavage: kmax = 3.3 ± 0.5 min−1, K1/2 = 8 ± 2 nM (R2 = 0.94). All of the values are the result of at least three independent experiments and are reported as mean ± average deviation.

