FIGURE 1.
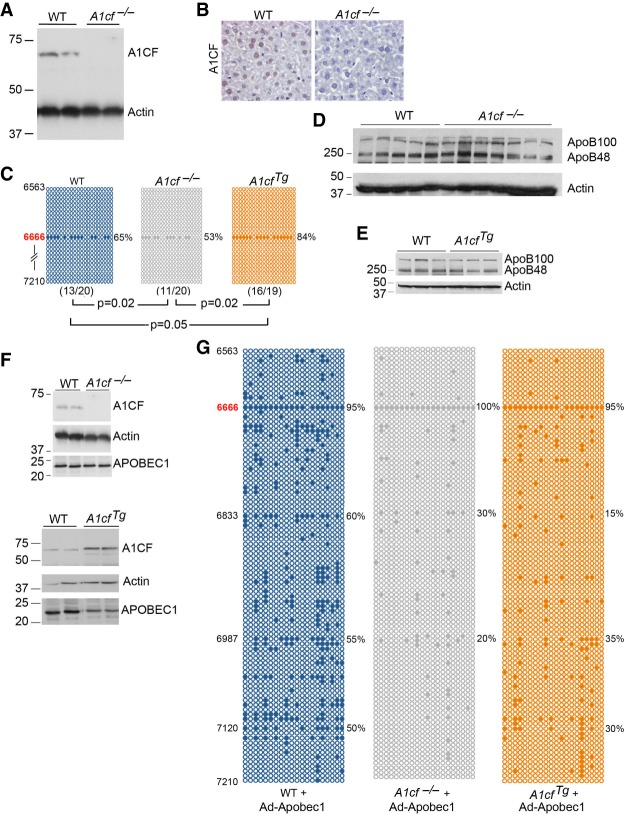
Alterations in hepatic A1CF expression produces only subtle changes in apoB RNA editing. (A) Hepatic expression of A1CF in wild-type (WT) and A1cf−/− mice. Actin was used as loading control. Molecular weights (kDa) are shown to the left. (B). Immunohistochemical detection of A1CF in WT livers showing nuclear localization of ACF and loss in A1cf−/− livers. (C) Hepatic apoB RNA editing by genotype. The region of apoB sequenced spans nucleotides 6563 to 7210. The data represent the average from three to four mice per genotype. Twenty clones were sequenced for each mouse. Positions of the edited cytidines are indicated on the left. Every circle represents a sequenced clone. Solid circles indicate C to U editing at the specified cytidine base, position indicated on the left. In all three genotypes, C to U editing is detected only at apoB canonical site C6666. Editing frequency (% edited clones at cytidine 6666) is indicated to the right. The numbers in parentheses under each panel represent the number of edited clones versus the total number of sequenced clones. The P-value under each panel indicates that editing at the canonical site of ApoB is statistically significant between A1cf−/− and WT liver; between A1cf−/− and A1cfTg; between A1cfTg and WT liver. Editing frequency at canonical C6666 editing site as mean ± SE: WT: 64 ± 4.2; A1cf−/− 53 ± 1.8; A1cfTg 84.5 ± 1.8. (D) Western blot detection of ApoB100 and ApoB48 in WT and A1cf−/− livers. Detection of Actin is used as loading control (n = 5–7 per genotype). (E) Western blot analysis of apoB100:B48 ratio in WT and transgenic A1CF liver (n = 3 per genotype). Actin is used as loading control. (F) A1CF and APOBEC1 expression in WT, A1cf−/−, and AcfTg mice injected with adenovirus-Apobec-1. Actin is used as loading control. (G) Hyperediting profile of hepatic ApoB RNA following adenoviral-expression of Apobec-1 in WT, A1cf−/− and A1cfTg mice. Representative data from three to four mice per genotype. Twenty clones per mouse were sequenced. Positions of the edited cytidines are indicated on the left. Editing frequencies at specific cytidine positions are shown to the right.

