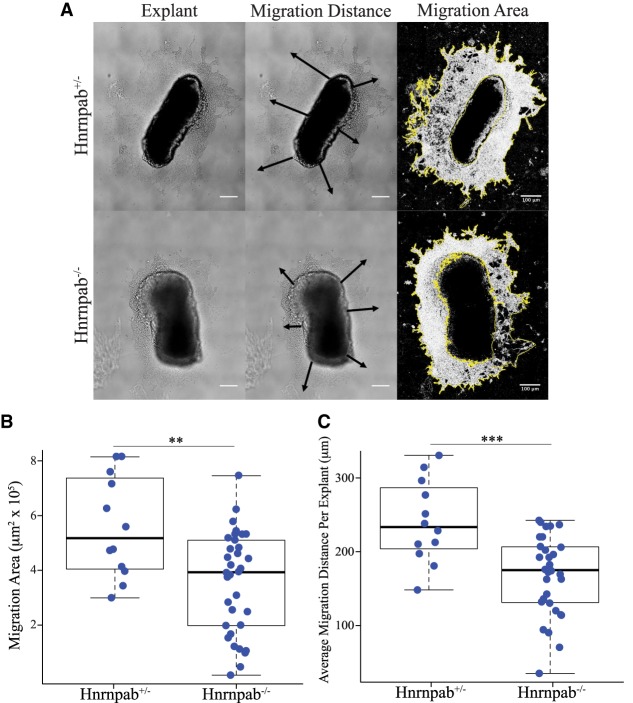
FIGURE 1.
Cell migration from SVZ explants is impaired in the absence of Hnrnpab. (A) Representative DIC images of SVZ explants (left panels), with these images indicating the measurement of either migration distance (center panel), or migration area (right panels). (Top panels) Hnrnpab+/−; (bottom panels) Hnrnpab−/−. (B) Box and whisker plots of the average migration area measurements (left chart) and migration distance (right chart, each data point represents the average of six measurements around one explant). Hnrnpab+/− n = 12; Hnrnpab−/− n = 29. P-values were calculated using one-way ANOVA followed by a pairwise t-test with Bonferroni correction. (***) P < 0.001, (**) P < 0.01.

