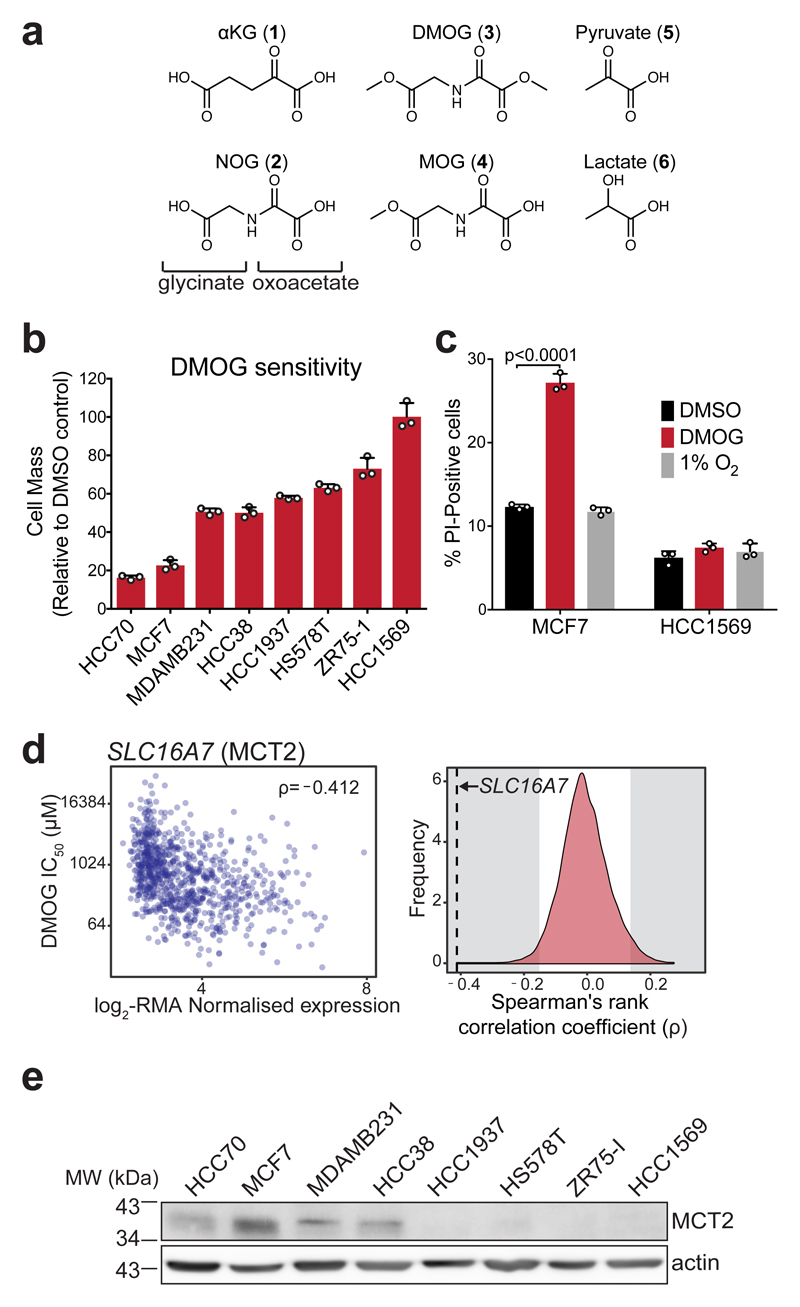
Figure 1. DMOG induces cytotoxicity that correlates with MCT2 expression and is not explained by differential inhibition of oxygen-sensitive dioxygenases.
a) Structures of αKG (1), NOG (2), DMOG (3) and MOG (4) (formed by de-esterification of DMOG in cells) shown alongside and the monocarboxylates pyruvate (5) and lactate (6) to illustrate structural similarities.
b) Cell mass accumulation of human breast cancer cell lines after 48 h treatment with 1 mM DMOG, relative to their respective vehicle (0.1% DMSO)-treated controls. Data shown as mean ± SD (n = 3 experimental replicates).
c) Measurement of propidium iodide (PI) uptake by flow cytometry to quantify cell death in MCF7 and HCC1569 cells treated for 48 h with vehicle (0.1% DMSO), 1 mM DMOG, or cultured at 1% O2 for 48 h (to inhibit dioxygenases). DMOG- and DMSO-treated cells were cultured at 21% O2. Data shown as mean ± SD (n = 3 experimental replicates), significance tested by 2-way ANOVA with Tukey’s multiple comparison correction.
d) Left: Correlation of robust multi-array average (RMA)-normalised SLC16A7 (encoding MCT2) mRNA expression and IC50DMOG across 850 different cancer cell lines. Data obtained from the Genomics of Drug Sensitivity in Cancer project (http://www.cancerrxgene.org). Spearman’s rank correlation coefficient is shown in the top right corner. Right: Spearman’s rank correlation coefficient of SLC16A7 (black dashed line) with respect to those of all other transcripts. Grey shaded region on either side indicates ±2-standard deviations cut-off used to define sensitivity-associated genes.
e) Western blot to assess MCT2 protein expression in lysates from breast cancer cell lines used in (b). Experiment performed once. Uncropped blot available in Supplementary Fig. 13a.

