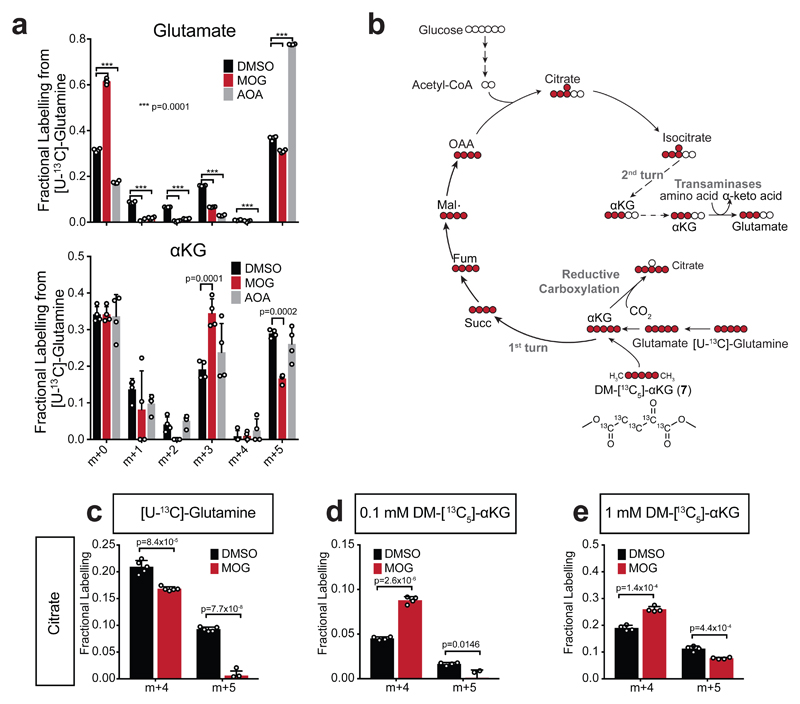
Figure 5. Evidence that inhibition of GDH-mediated glutamine carbon flux accounts for MOG-induced metabolic changes associated with cytotoxicity.
a) Isotopologue distribution of glutamate and αKG in MCF7 cells after 4 h of labelling with [U-13C]-glutamine in the presence or absence of 1 mM MOG or 1 mM aminooxyacetate (AOA) compared to 0.1% DMSO control. Data shown as mean ± SD (n = 4 experimental replicates) and significance was tested with 2-way ANOVA with Dunnett’s multiple comparisons correction.
b) Scheme illustrating theoretical labelling pattern in the indicated metabolites, generated by incubation of cells with either [U-13C]-glutamine or DM-[13C5]-αKG (7). 13C-carbons are shown in red circles and 12C shown in white.
c) Quantification citrate m+4 isotopologue (generated by TCA in the oxidative direction), or citrate m+5 isotopologues [generated by reductive carboxylation (RC) of αKG] in MCF7 cells incubated with [U-13C]-glutamine for 4 h in the presence of 0.1% DMSO or 1 mM MOG. Data shown as mean ± SD (n = 5 experimental replicates). Significance was tested with 2-sided multiple t-tests using Holm-Sidak’s correction for multiple comparisons.
d) As in (c) but labelling was with tracer amounts (0.1 mM) of DM-[13C5]-αKG (n = 4 experimental replicates).
e) As in (c) but labelling was with rescue amounts (1 mM) of DM-[13C5]-αKG (n = 4 experimental replicates).

