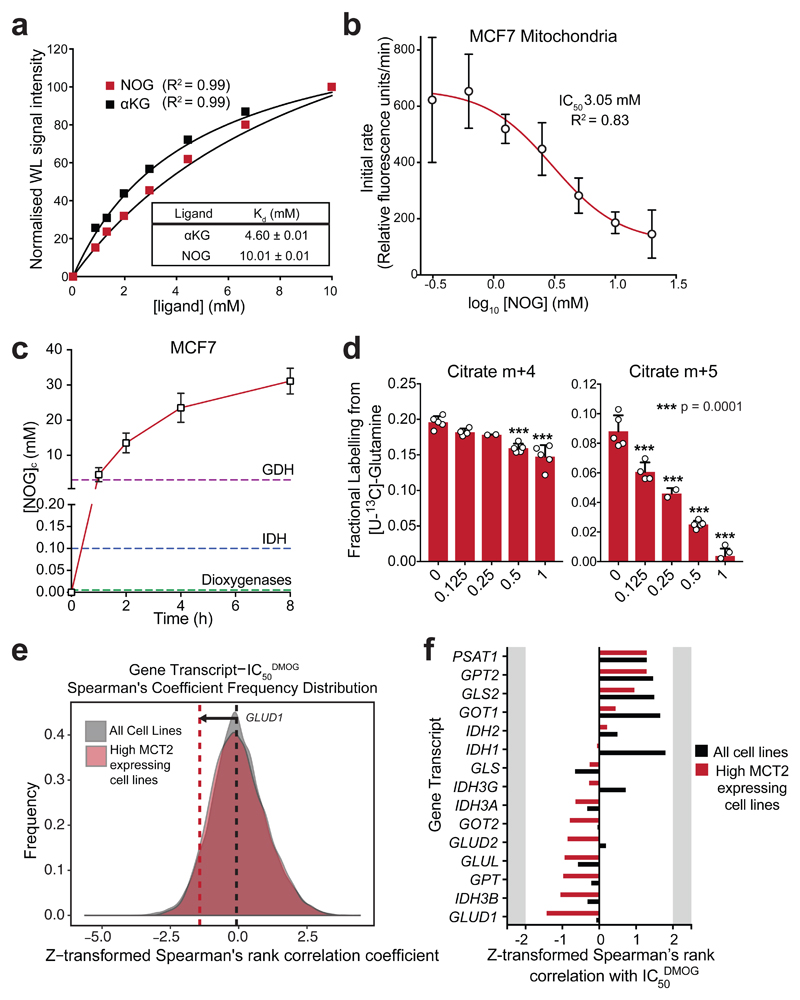
Figure 6. NOG binds to GDH and inhibits its enzymatic activity.
a) Normalised waterLOGSY signal intensities in the presence of increasing concentrations of either αKG or NOG. Kd values were determined by fitting a one-site specific binding curve in GraphPad Prism. Single replicates were taken at each ligand concentration; experiments were performed 3 times with similar results.
b) GDH activity in MCF7 cell mitochondrial lysates pre-incubated for 15 min in the presence of increasing concentrations of NOG. Data shown as mean ± SD (n = 3 experimental replicates). IC50 determined by fitting a log[inhibitor] vs response (variable slope, 4 parameters) curve in GraphPad Prism.
c) [NOG]ic in MCF7 cells incubated with 1 mM MOG for increasing durations. Data shown as mean ± SD (n = 4 experimental replicates). Dashed lines indicate the measured IC50NOG values of GDH from (a), and those reported for IDH36 and dioxygenases17.
d) Quantification of the citrate m+4 isotopologue (generated by TCA in the oxidative direction), and citrate m+5 isotopologue (generated by RC) in MCF7 cells incubated with [U-13C]-glutamine for 4 h in the presence of different concentrations of MOG. Data shown as mean ± SD (5 experimental replicates). Statistical significance tested by one-way ANOVA, and multiple comparisons to the 1 mM MOG control were corrected using Dunnet’s method.
e) Frequency distribution graphs of Spearman’s rank correlation coefficient values from all genes vs. IC50DMOG, using all cells lines (850 different cell lines, grey) or only the top quartile of SLC16A7-expressing cell lines (213 cell lines, red) as in (f). The dashed lines represent the correlation coefficient for GDH (GLUD1) and DMOG IC50 in the analysis with all cell lines (850, black), and with only the top quartile of SLC16A7-expressing cell lines (red).
f) Correlation coefficients from Spearman’s rank analysis of transcripts encoding proteins involved in glutamine metabolism and IC50DMOG. Black bars represent correlation coefficients when all cell lines are included in the analysis (850 different cell lines, as for Fig. 1d), while red bars represent coefficients when only the cell lines that express the highest levels of SLC16A7 (213 cell lines) are included.

