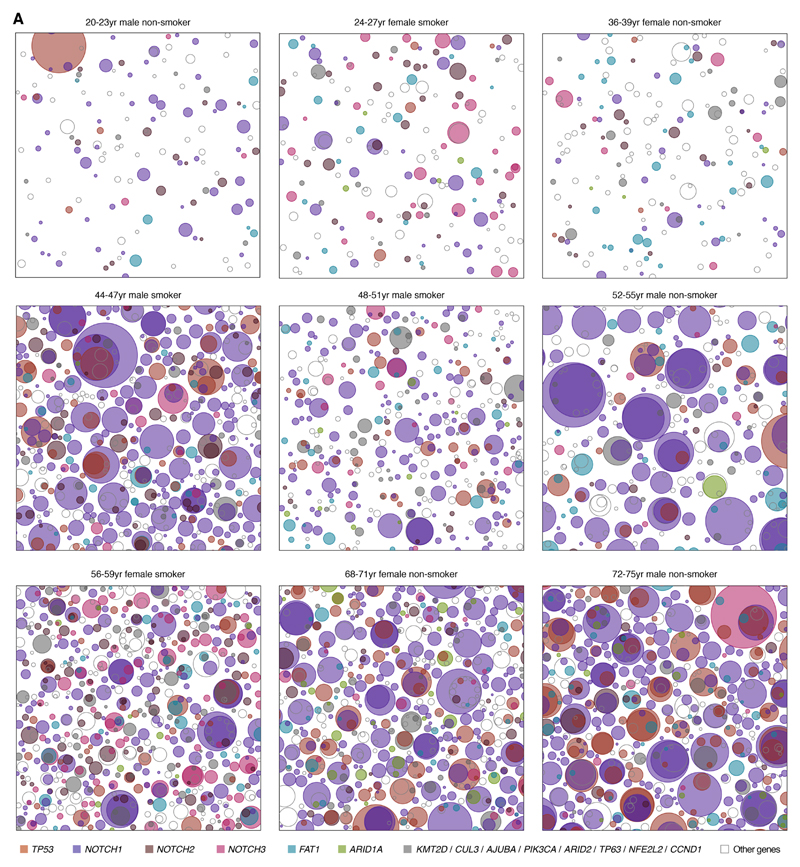
Fig. 3. Variation of the mutational landscape across the 9 donors.
Representative patchwork plots from each donor. Each panel is a schematic representation of the mutant clones in an average 1 cm2 of normal esophageal epithelium from each donor. To generate each figure, a number of samples from the donor are randomly selected to amount to 1 cm2 of tissue and all clones detected are represented as circles randomly distributed in space. The density and size of the clones are inferred from the sequencing data and the nesting of clones and subclones is inferred from the data when possible and randomly allocated otherwise (Methods S5.4).

