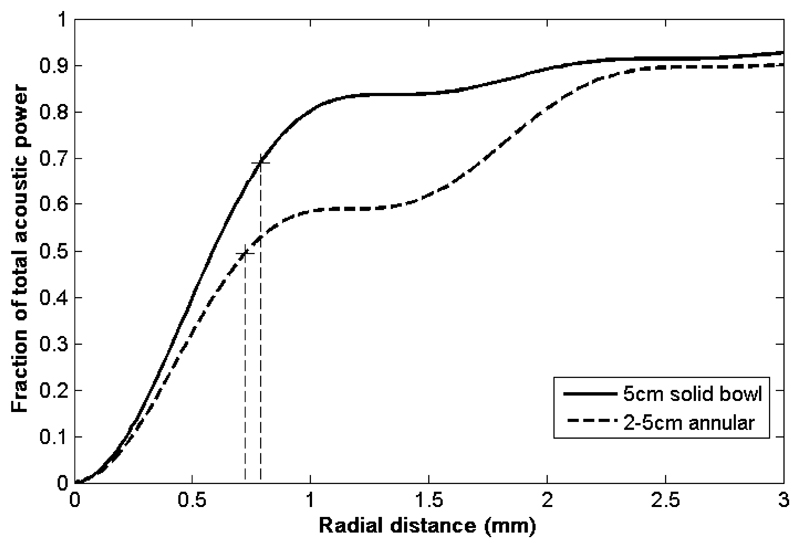
Figure 2.
The fraction of total acoustic power (G curve as described in Equation 5) passing through a circle in the focal plane for a 5 cm radius spherical bowl transducer (solid line) and an annular transducer with 5 cm outer radius and 2 cm hole inner radius (dashed line) transducer are shown. The dashed vertical lines represent the respective 6 dB positions and corresponding G values at those positions for both transducers, demonstrating the lower fractional power that passes through the focal region for the annular transducer.

