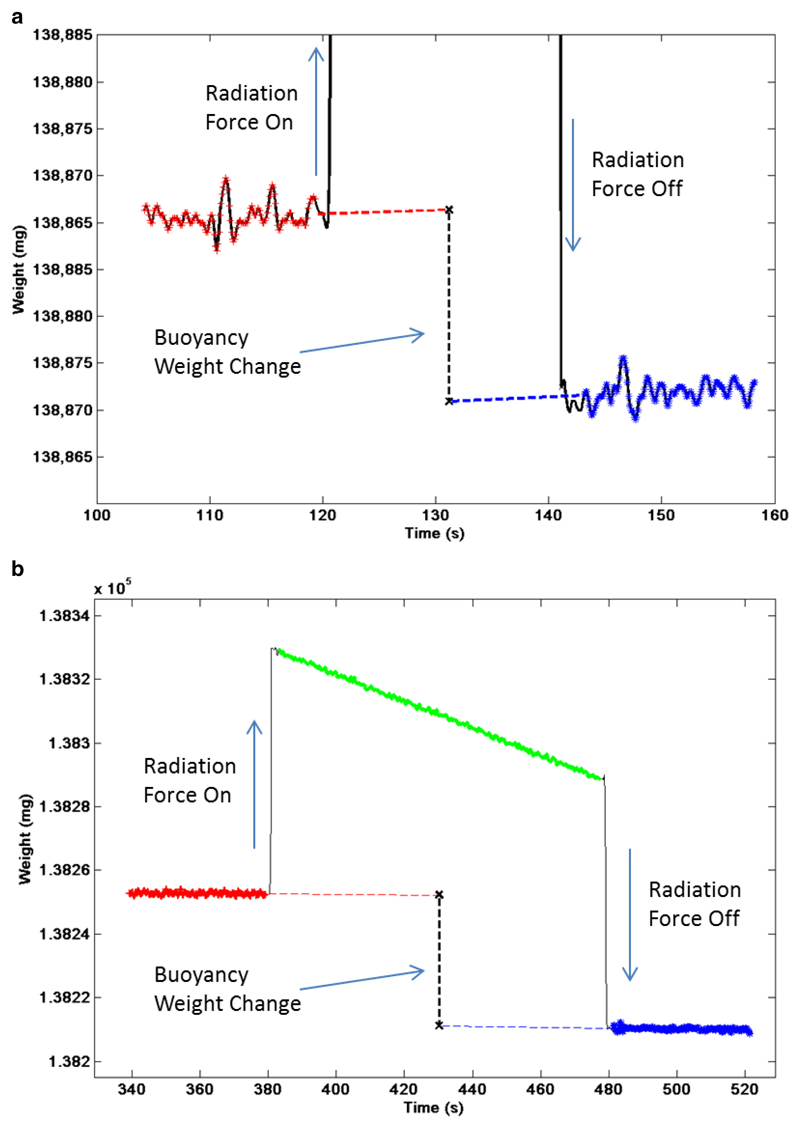
Figure 4.
Example of acoustic power measurement from transducer 5. The weight data measured by a digital balance as a function of time is shown for the (a) ‘low’ power setting (constant wave 20 s exposure), and (b) ‘high’ power setting (100 s burst tone exposure at 5% duty cycle). The radiation force on (start of exposure), radiation force off (end of exposure) are indicated together with the net weight change induced by the buoyancy effect. The net weight change is determine by extrapolation using a linear trend from data points before (red) and after (blue) the exposure, the vertical offset between these trends is calculated at the temporal midpoint of the exposure. For clarity the weight scale in the top graph has been expanded, but as a result the full effect of the radiation force at the onset and end of exposure cannot be seen.

