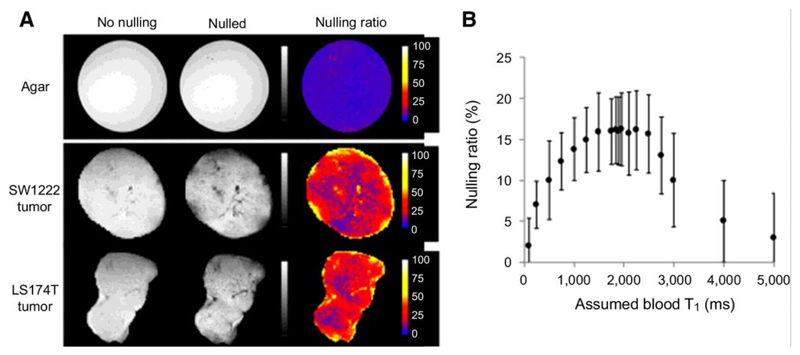
Figure 2.
Evaluation of vascular nulling in tumor xenograft models. (a) Example maps showing the nulling ratio (the ratio of images acquired with vascular nulling to one acquired without vascular nulling) in an agar phantom and two different tumors. In the agar phantom, the nulling ratio was zero (top row), as expected due to the absence of flowing fluid. (b) A plot of the average nulling ratio as a function of the assumed blood longitudinal relaxation time (T1,blood). The assumed value of T1,blood is used to set the recovery time following the inversion preparation (trec = ln(2) T1,blood). The graph shows that, for a range of T1,blood of 1600 to 2500 ms, the nulling ratio is maximal. At lower values, the nulling is lower as the signal from blood has not recovered to a null point; at larger values, the signal has recovered past the null. The plateau represents a region where the signal from blood is near to or at the null point and has sufficient time to flow into and replace unlabelled blood within the imaging slice.

