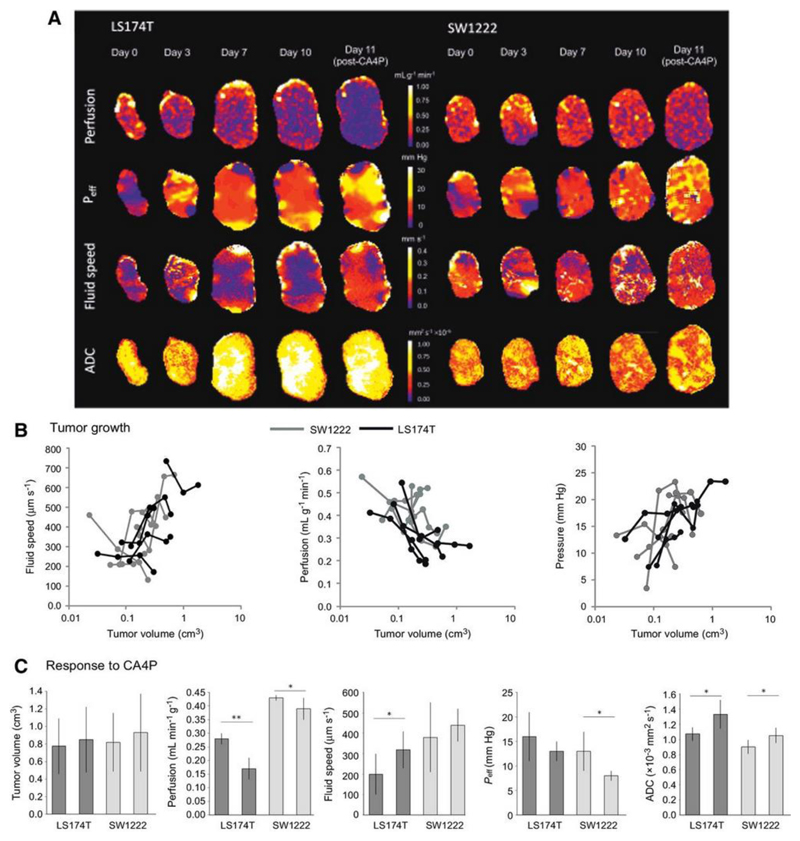
Figure 7.
Tumor growth and response to therapy characterised with convection-MRI. (a) Example maps of vascular perfusion, effective pressure (Peff), fluid velocity and apparent diffusion coefficient (ADC) during 10 days of growth in two colorectal tumor xenografts (LS174T and SW1222), and at 24 hours following a single dose of the vascular disrupting agent CA4P (100 mg kg-1). (b) Scatter plots of the mean values of these parameters, from the whole tumor cohort. Fluid speed, measured using convection-MRI, tends to increase with tumor volume), whilst perfusion and Peff decrease. Each point corresponds to a single measurement from a tumor, and black and grey lines connect individual tumors (LS174T (n = 6) and SW1222 (n = 7) colorectal tumor xenografts, respectively). (c) shows the mean change in each parameter at 24 hours following treatment with CA4P. Tumor volume did not significantly change with treatment, whilst in LS174T tumors, perfusion decreased and interstitial fluid speed and ADC increased. In SW1222 tumors, perfusion and Peff significantly decreased and ADC significantly increased. Error bars represent the standard error in the mean; ** denotes p<0.01, * denotes p<0.05.

