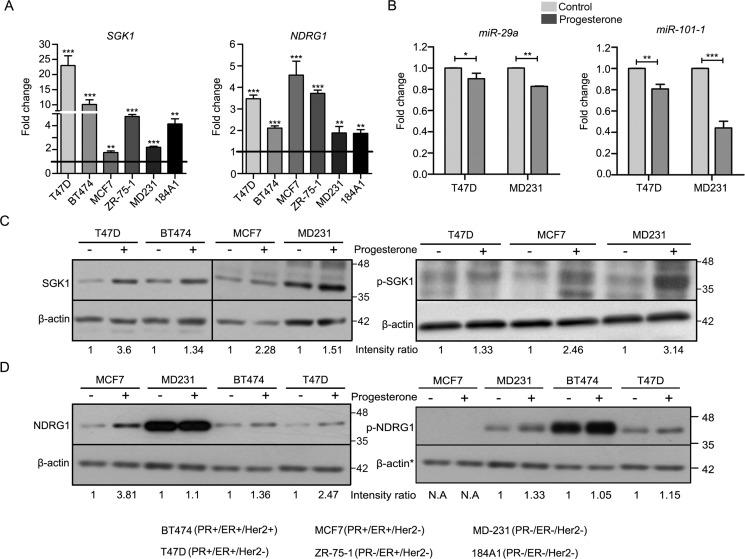
Figure 1.
Validation of expression of SGK1 and NDRG1, and miR-29a and miR-101-1 expression in breast cell lines treated with progesterone. A, quantitative real-time PCR analysis for validation of expression of SGK1 and NDRG1 transcripts in breast cell lines in response to progesterone. Expression of both of the genes was normalized with respect to expression of GAPDH in each cell line. Data are plotted as -fold change for each gene with respect to the expression in control sample of each cell line. Horizontal black line, gene expression in control cells. The figure is representative of three independent experiments performed in triplicates. p value was calculated using Student's unpaired t test. *, p < 0.05; **, p < 0.005; ***, p < 0.0005. B, transcript levels of miR-29a and miR-101-1 were measured using real-time PCR analysis in T47D and MDA-MB-231 cells treated with progesterone. The graph is plotted as expression -fold change of the two microRNAs normalized to expression of U6 small RNA in progesterone-treated versus control cells. Transcript levels in both control and progesterone-treated cells are shown. The figure is representative of two independent experiments performed in triplicates. C, Western blot analysis for SGK1 (left) and p-SGK1 (right) in breast cancer cells treated with progesterone. Minus sign, control; plus sign, progesterone-treated samples. β-Actin was used as an internal loading control. Numbers on the blot indicate intensity ratio for SGK1 and p-SGK1, normalized to β-actin levels in the respective cell lines. The Western blot analyses for SGK1 and p-SGK1 are representative of three independent experiments. D, Western blot analysis of NDRG1 (left) and p-NDRG1 (right) in breast cancer cells treated with (+) and without (−) progesterone. *, β-actin protein was used as a loading control for Western blotting and is common for both of the blots, shown twice. Numbers on the blot indicate intensity ratio for NDRG1 normalized with respect to β-actin levels, whereas p-NDRG1 levels have been normalized with respect to total NDRG1 expression. The Western blot analysis is representative of three independent experiments. Error bars indicate S.D.

