Figure 11.
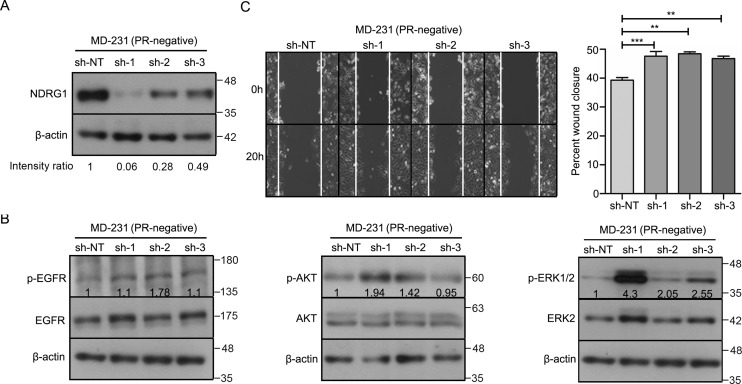
Depletion of NDRG1 activates multiple cellular kinases and increases migration of MDA-MB-231 cells. A, Western blot analysis depicting knockdown of NDRG1 in MD-231 breast cancer cells (PR-negative). sh-NT was used as vector control for NDRG1 expression. β-Actin protein was used as a loading control for Western blotting. Numbers on the blot indicate the intensity ratio for NDRG1, normalized to respective β-actin levels. The analysis is representative of three independent experiments. B, Western blot analysis of p-EGFR (Tyr-1086), p-AKT (Ser-473), and p-ERK1/2 (Thr-202/Tyr-204) in NDRG1 knockdown clones of MD231 cells. β-Actin was used as a loading control for Western blotting, and β-actin for the p-EGFR and p-ERK1/2 panels is the same. The numbers on the blot indicate average intensity ratio calculated from all of the three replicate experiments for phosphorylation levels of EGFR, AKT, and ERK1/2, normalized to respective total protein levels (EGFR, AKT, and ERK2). Western blot analysis is representative of three independent experiments. C, migration of cells was measured from 0 to 20 h by using a time-lapse wound healing assay. The bar plot represents percentage wound closure (average of the three biological replicate experiments), and the comparison was with respect to sh-NT. The figure is representative of three independent experiments performed in triplicates. p value was calculated using Student's unpaired t test. **, p < 0.005; ***, p < 0.0005; ns, not significant. Error bars indicate S.D.

