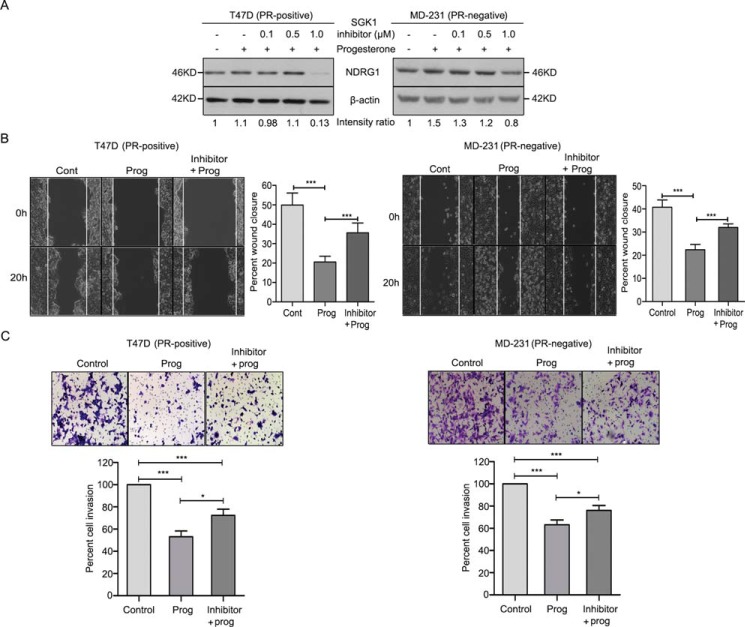
Figure 6.
SGK1 inhibitor phenocopies the effect of depletion of SGK1 in breast cancer cells. A, Western blot analysis representing the expression of NDRG1 in T47D (PR-positive) and MDA-MB-231 cells (PR-negative) treated with the SGK1 inhibitor and progesterone. Expression of NDRG1 was normalized with respect to β-actin levels in the respective cell lines. The numbers on the blot indicate the intensity ratio of expression of NDRG1 with respect to untreated cells in each cell line. The Western blot analysis is representative of three independent experiments. B, cell migration assay of breast cancer cells treated with SGK1 inhibitor and progesterone. The motility of cells from the initial to the 20-h time point is plotted as percentage cell migration, and the comparison was between control, progesterone-treated, and SGK1 inhibitor + progesterone–treated conditions. The bar plot indicates percentage wound closure in each of the three treatment conditions. Analysis is representative of three independent experiments performed in triplicates. C, cellular invasion assay was performed with SGK1 inhibitor treatment in T47D and MDA-MB-231 cells. Panels show cells with no treatment, cells with progesterone treatment, and cells with both inhibitor and progesterone combination treatment. The bar plot represents percentage cell invasion for each of the treatment conditions. The figure is representative of three independent experiments performed in triplicates. p value was calculated using Student's unpaired t test. *, p < 0.05; ***, p < 0.0005. Error bars indicate S.D.

