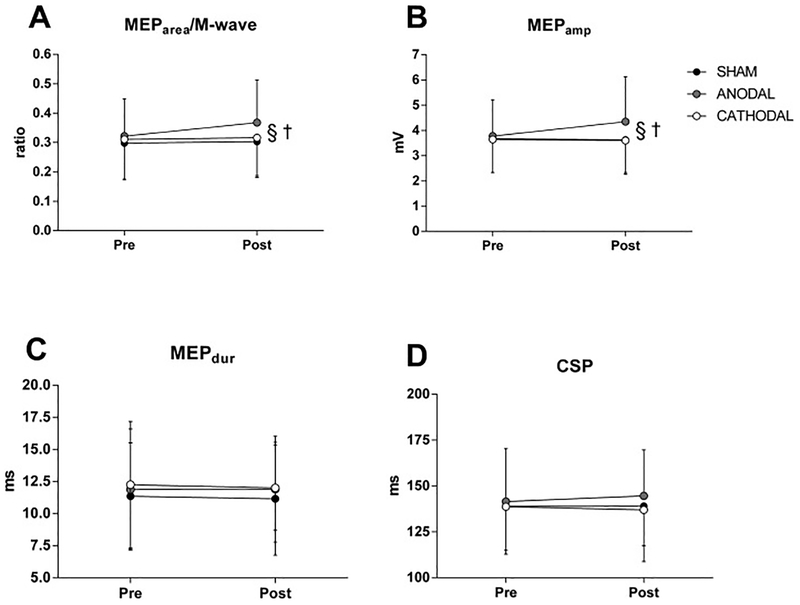
Fig. 4.
Corticospinal response before and after transcranial direct current stimulation (tDCS). Panel A shows motor evoked potential area (MEParea) and muscular wave (Mwave) MEParea/M-wave ratio. Panel B shows MEP peak to peak amplitude (MEPamp). Panel C shows MEP peak to peak duration (MEPdur); Panel D shows MEP cortical silent period (CSP); §Denotes significant difference from CATHODAL and SHAM (P < 0.05); †Denotes significant condition × time interaction (P < 0.05). Data are presented as mean ± SD (n = 12).

