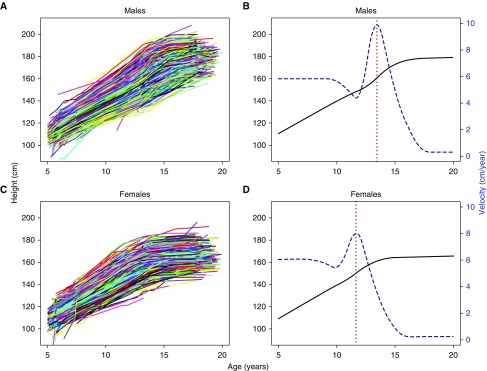
Figure 2.
Individual height growth curves for (A) 4,772 males, with 33,367 measurements, and (C) 4,849 females, with 33,783 measurements, from age 5 to 20 years. Mean curves, fitted by the SITAR models, are illustrated for height growth (in solid black) and height velocity (in dashed blue) for (B) males and (D) females, with vertical lines (in dotted red) indicating mean pubertal age (13.5 and 11.7 yr for males and females, respectively). The right vertical axis in B and D represents the height velocity (cm/yr). SITAR = SuperImposition by Translation and Rotation.

