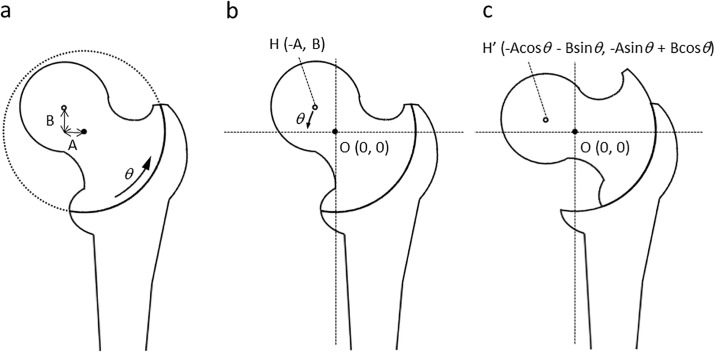
Fig 4. Diagram of mathematical model of curved intertrochanteric varus osteotomy.
a) Black points show the center of the osteotomy arc (O), defined as a origin (0, 0). White points indicate the center of the femoral head (H). The lateral shift and distal shift of the center of the femoral head from origin are A and B, respectively. B) Before and c) after osteotomy; the coordinate of H changes as shown.

