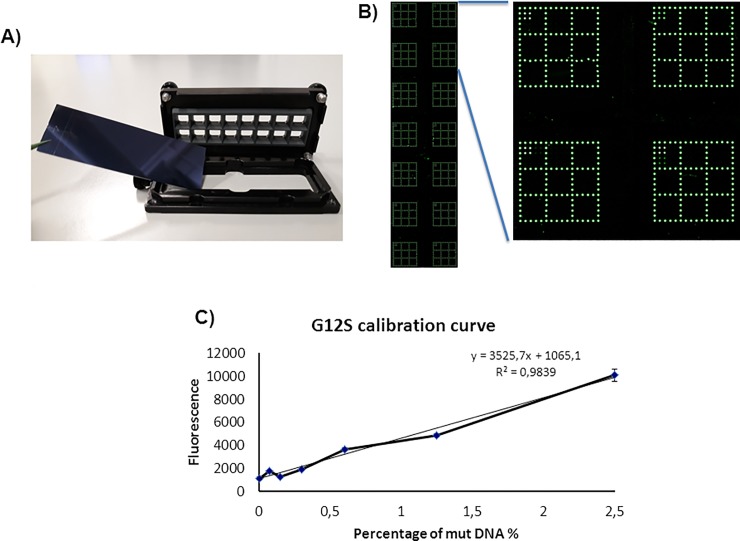
Fig 3. G12S calibration curve.
A) Picture showing the setup utilized to realize the calibration curves for the KRAS codon 12–13 mutations. B) Microarray scanning of the Cy3 signal of the coated silicon slide and the magnification of a portion of it showing the result of the hybridization of four different concentration of mutant DNA in four different wells. C) Plot representing the relative fluorescence intensity of the signal corresponding to the Cy3-labeled mutated single strand PCR bound to the G12S barcode probe. The points, calculated as the average of the intensity of four spots, correspond to the percentage of the KRAS G12S mutation in a background of KRAS wild-type DNA. The value at point 0 represents the relative fluorescence intensity of the background presents on the G12S barcode probe array of the well hybridized with wild-type control sample. The error bars are the standard deviations of the fluorescence intensity of each well. The equation of the trend line of the graph is utilized to extrapolate the limit of detection (LOD) for the assay.

