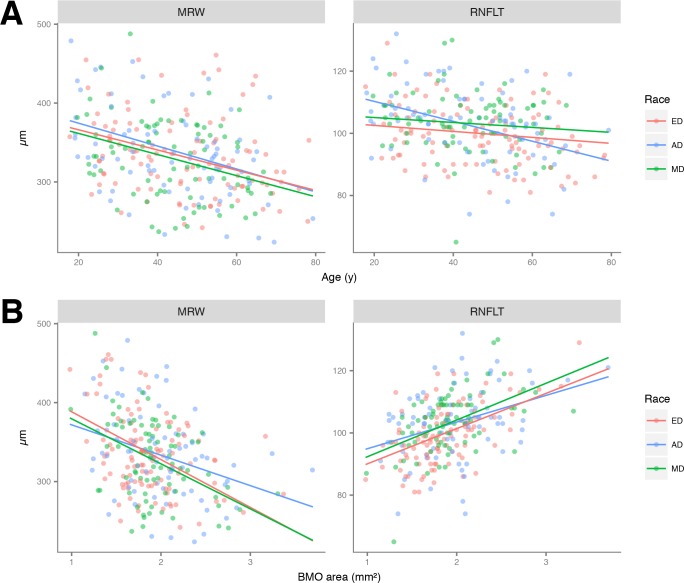
Fig 4.
(A) Scatterplots showing the relationship between global minimum rim width (MRW) and age (left) and global peripapillary retinal nerve fiber layer thickness (RNFLT) and age (right), by racial group. Lines represent the coefficients of multivariable regression, adjusted for Bruch’s membrane opening area. (B) Scatterplots showing the relationship between global minimum rim width (MRW) and Bruch’s membrane opening (BMO) area (left) and global peripapillary retinal nerve fiber layer thickness (RNFLT) and BMO area (right) by racial group. Lines represent the coefficients of multivariable regression, adjusted for age. ED: European Descent; AD: African Descent; MD: Mixed Descent.

