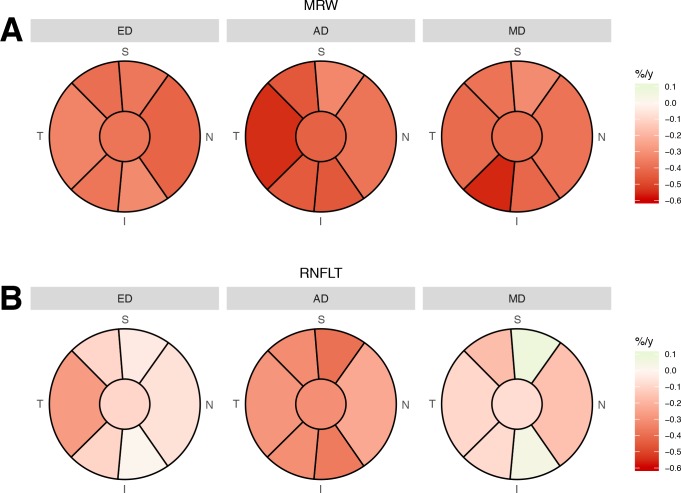
Fig 6.
Graphs showing the sectorial age-related percentage decay (%/y) of (A) mean Bruch’s membrane opening minimum rim width (MRW) and (B) peripapillary retinal nerve fiber layer thickness (RNFLT) globally (central circle) and in 6 sectors. Mean decay in each sector is color-coded according to the scale in the legend. ED: European Descent; AD: African Descent; MD: Mixed Descent.

