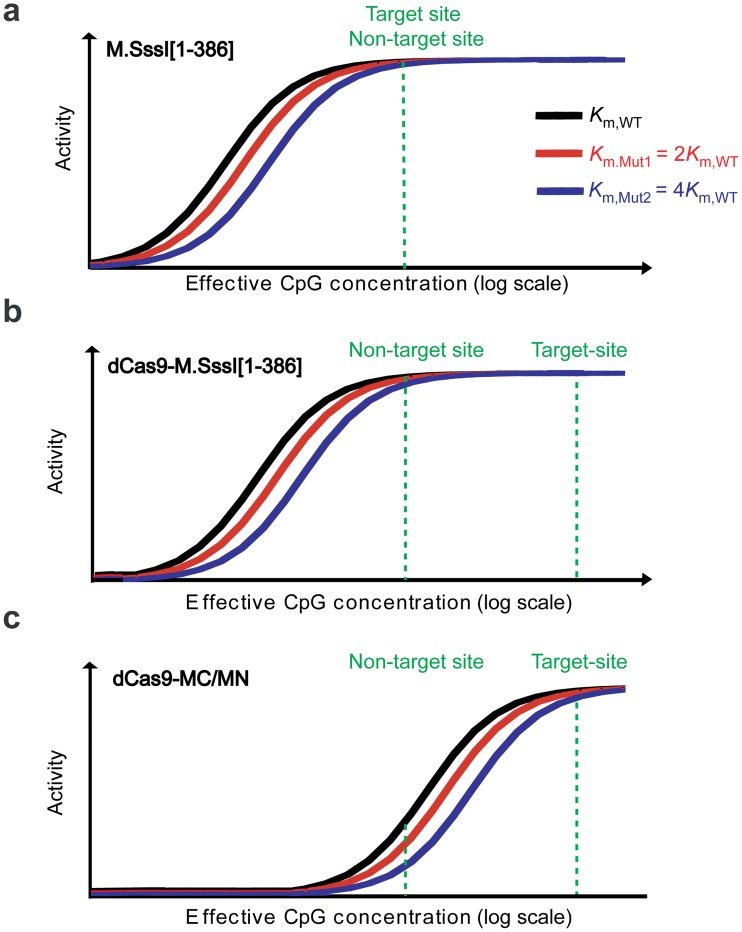
Fig 5. Model for how affinity-weakening mutations improve methylation specificity.
Schematic representation of the effect on methylation activity of mutations that reduced a methyltransferase’s binding affinity to DNA for (a) M.SssI (b) dCas9-M.SssI, and (c) dCas9-MC/MN. Methylation activity of the methyltransferase (black curve) and the associated variants with reduced affinity for the DNA (red curve and blue curve) as a function of the effective CpG concentration as calculated using the kinetic mechanism of homologue methyltransferase M.HhaI [27]. Effective concentration is plotted in log scale. The three curves differ in the value of Km for DNA as indicated. The green dashed lines indicate hypothetical effective concentrations of target and non-target sites, as indicated. These lines reflect the fact that dCas9 directing dCas9-M.SssI and dCas9-MC/MN to the vicinity of the target CpG site will increase the effective concentration of the target CpG site.

