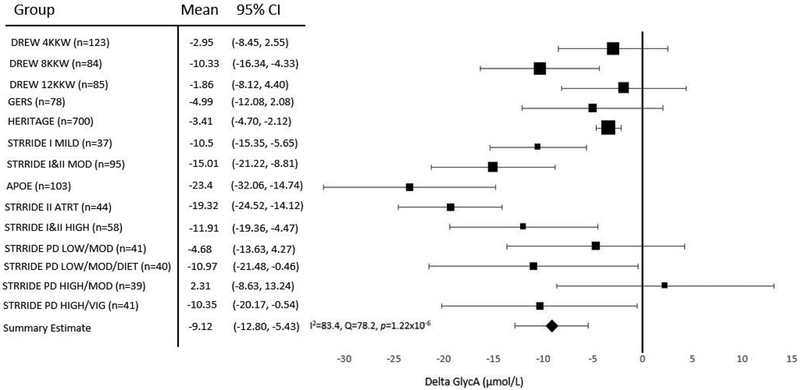
Figure 1. Adjusted meta-analysis results for change in GlycA following various exercise interventions.
Adjusted mean change with 95% confidence intervals (CI) are shown. Mean values were adjusted for age, sex, race, baseline BMI, and baseline GlycA. Summary estimate = −9.12 μmol/L, I2=83.4, Q=78.2, p=1.22×10⁻⁶. Size of the marker for the mean value of each exercise group represents the relative weight of the study in the combined analysis. KKW, kilocalories per kilogram of body weight per week.

