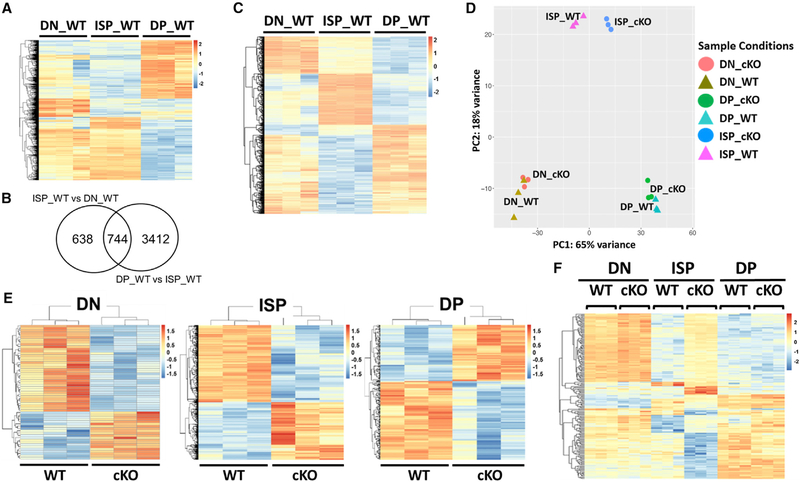
Figure 3. Brd4 Deletion Preferentially Targets ISP Thymocytes.
All of the heatmaps represent genes with a signal intensity fold change > 2 and FDR <0.01.
(A) Heatmap comparing RNA expression profiles of DN, ISP, and DP thymocytes from WT thymus.
(B) Venn diagram summarizing the differences in gene expression between WT ISP thymocytes and WT DN and DP, respectively.
(C) Heatmap of the 744 genes differentially expressed in WT ISP relative to DN and DP.
(D) Principal-component analysis (PCA) of gene expression profiles of DN, ISP, and DP thymocytes from BRD4 WT and BRD4 cKO.
(E) Heatmaps illustrating the effects of BRD4 deletion by LCK-Cre (cKO) relative to WT on gene expression in DN, ISP, and DP thymocytes.
(F) Heatmap comparing the expression of the 194 BRD4-dependent genes of the 744 that are differentially expressed genes in WT ISP relative to DN and DP.
See also Figure S3.

