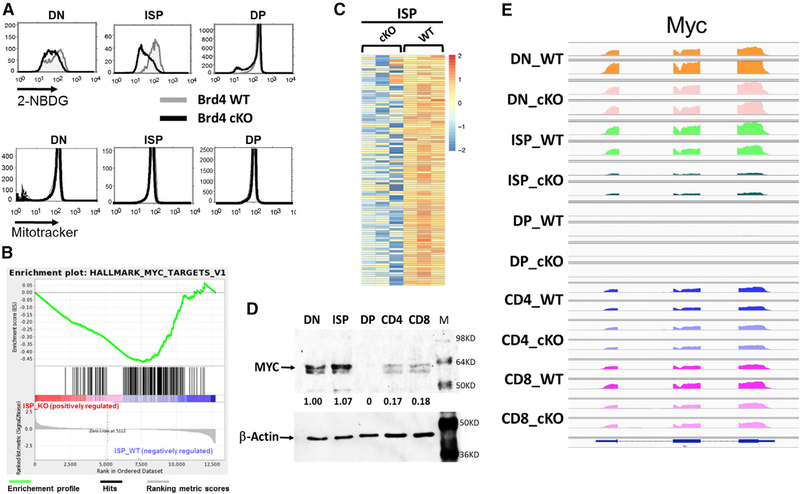
Figure 4. BRD4 Regulates Glycolytic and c-Myc Pathways in ISP Thymocytes.
(A) Top: glucose uptake in WT and BRD4 cKO DN, ISP, and DP thymocytes, as measured by uptake of the glucose analog 2-NBDG and FACS. WT, gray; BRD4 cKO, black. Bottom: mitochondrial mass of Brd4 WT and cKO DN, ISP, and DP thymocytes, as assessed by MitoTracker uptake and FACS.
(B) Enrichment plot of the c-Myc target gene set in ISPs. The c-Myc_targets_v1 gene set is significantly downregulated in the Brd4 cKO (p < 0.0001). The green curve shows the running sum of enrichment score (ES) for ranked genes. The hash marks under the plot represent the genes that are the leading-edge subset, which accounts for the gene set’s enrichment signal.
(C) Heatmap showing the normalized expression of the top 105 downregulated myc_target_v1 genes in BRD4 cKO ISP thymocytes.
(D) Immunoblot analysis of c-MYC and β-Actin in different populations of thymocytes.
(E) IGV visualization of Myc gene expression in WT DN, ISP, DP, CD4, and CD8 thymocytes. IGV data range: 0–1,000.
See also Figure S4.

