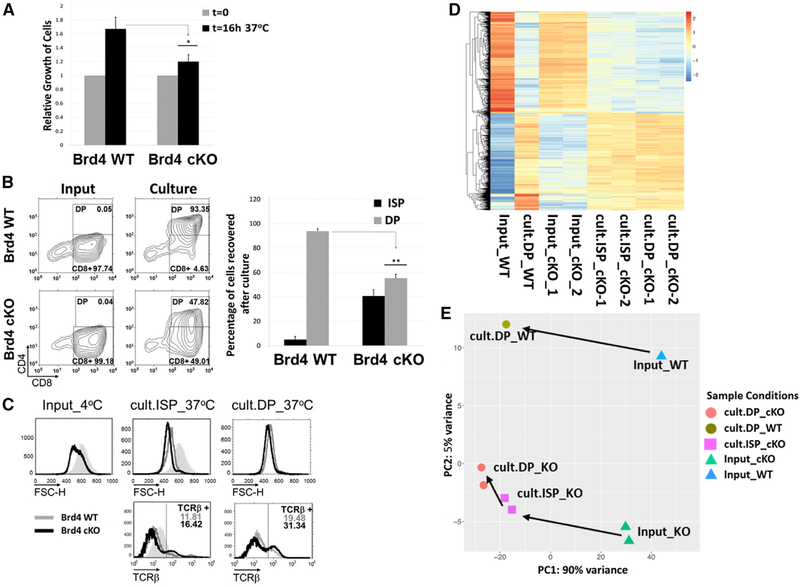
Figure 5. BRD4 cKO ISPs Are Blocked in Their Maturation into DP Thymocytes In Vitro.
(A) ISPs from BRD4 cKO and WT thymi were cultured overnight, and the extent of their proliferation was quantified as cell recovery (percent of input) after theovernight culture; data are the mean ± SEM of four independent experiments. *p < 0.05; t test.
(B) Maturation of ISP into DP (culture panel), relative to the input (input panels) of ISPs from WT (top) and cKO (bottom), was assessed by flow-cytometricmeasurement of CD4 and CD8 surface marker expression. The histogram (right) represents the mean ± SEM of four independent cultures of Brd4 cKO ISPs and four WT ISPs. **p < 0.005; t test.
(C) FACS of the input ISPs remaining after culture (cult.ISP_37˚C) and DP appearing after culture (cult.DP_37˚C) (from B) assessing their size by forward scatter (top) and TCRβ surface expression (bottom). WT, gray; Brd4 cKO, black; shaded peak, WT ISP input. The data are representative of four independent experiments.
(D) The heatmap was plotted based on 3,194 genes that are differentially expressed between DP_WT after overnight culture (cult.DP_WT) and input ISP_WT(Input_WT). Input ISPs from Brd4 cKO mice (Input_cKO), remaining cKO ISPs (cult.ISP_cKO), and cKO DPs (cult.DP_cKO) after overnight culture.
(E) PCA representation of the WT and cKO input ISP and thymocyte populations after overnight culture.
See also Figure S5.

