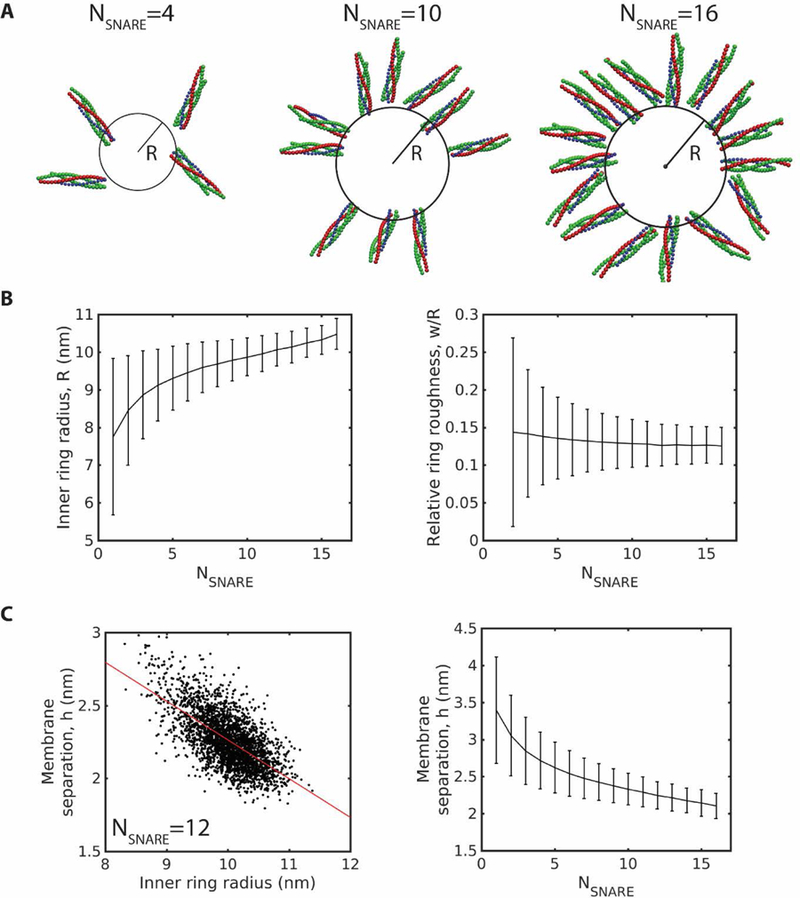
Fig. 4.

With more SNAREpins, assembled rings are larger, more ordered, and press membranes closer together with higher energies. Mean values are obtained by time averaging over 60 µs. Error bars: SD over the same time frame. (A) Snapshots of typical simulated rings with 4, 10, and 16 SNAREpins after reaching steady state. (B) Steady state ring radius and relative roughness versus number of SNAREpins. (C) Scatter plot of instantaneous membrane separation and inner ring radius for a steady state ring of 12 SNAREpins reveals a negative correlation left. Red line: linear fit, . Membrane separation versus number of SNAREpins in steady state rings, right.
