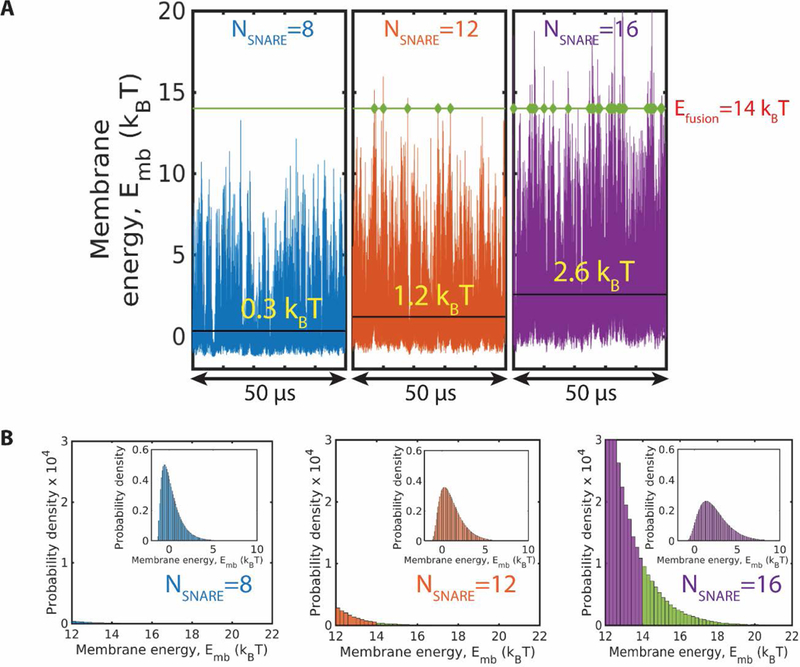
Fig. 5.

With more SNAREpins, membrane energy fluctuations are greater and the fusion energy threshold is reached sooner. (A) Membrane energy versus time in three simulations with 8, 12 and 16 SNAREpins, respectively. For a hypothetical fusion energy of (green line), the instants when the fluctuating energy attains the fusion energy value are indicated. With more SNAREpins, energy fluctuations are greater and the fusion threshold is reached more frequently. Mean membrane energy values are indicated (black lines). (B) Tails of the membrane energy probability distributions for the 3 simulations of (A). Insets show the full distributions. The weighting for energies above the fusion threshold (shown green) increases with the number of SNAREpins.
