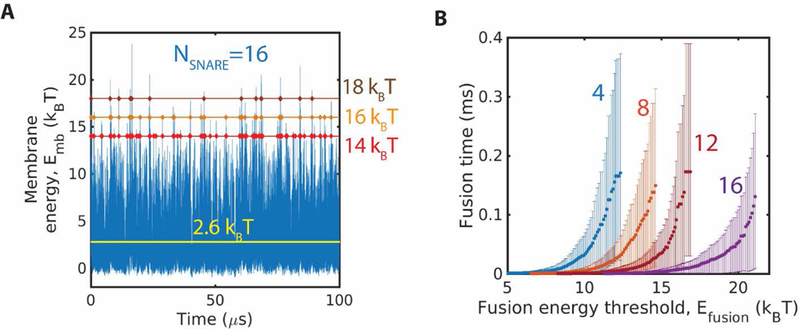
Fig. 6.

Waiting times for membrane energy fluctuations to attain a threshold value increase with the energy value and decrease with number of SNAREs. (A) Membrane energy versus time in a simulation with 16 SNAREpins. Three hypothetical fusion energy thresholds are indicated. Energy fluctuations reach 14 once every ~2 , 16 once every ~7 , and 18 once every ~20 , The mean energy is indicated (black line). (B) Fusion time versus hypothetical value of the fusion energy threshold, , for four values of the number of SNAREs, . The fusion time is the mean waiting time for the first instant that an energy fluctuation reaches . Fusion time increases with and . Error bars are 95% confidence intervals.
