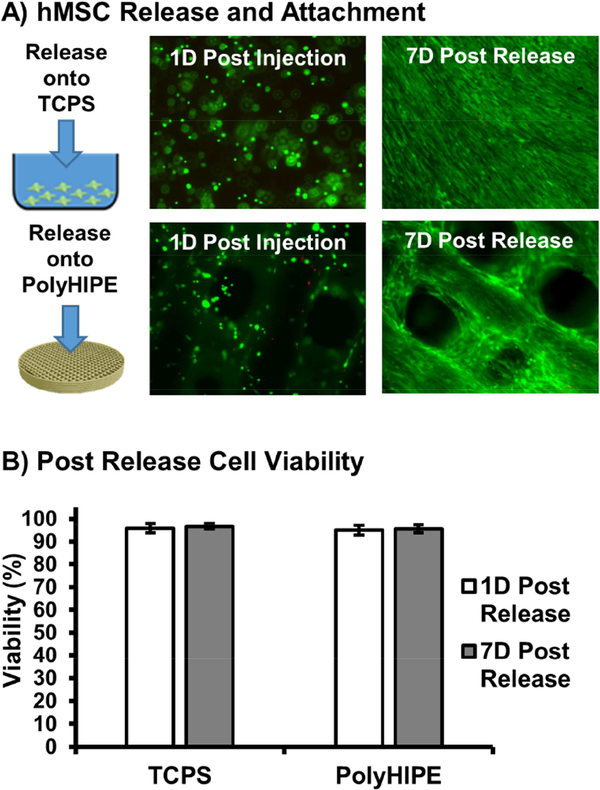
Figure 5.
Micrographs illustrating live (green) and dead (red) cells 1 day post encapsulation and 7 days post release onto TCPS and polyHIPE substrates (A). Percent hMSC viability 1 day and 7 days following release and attachment onto TCPS and polyHIPE substrates (B). All data represents average ± standard deviation for n = 12.

