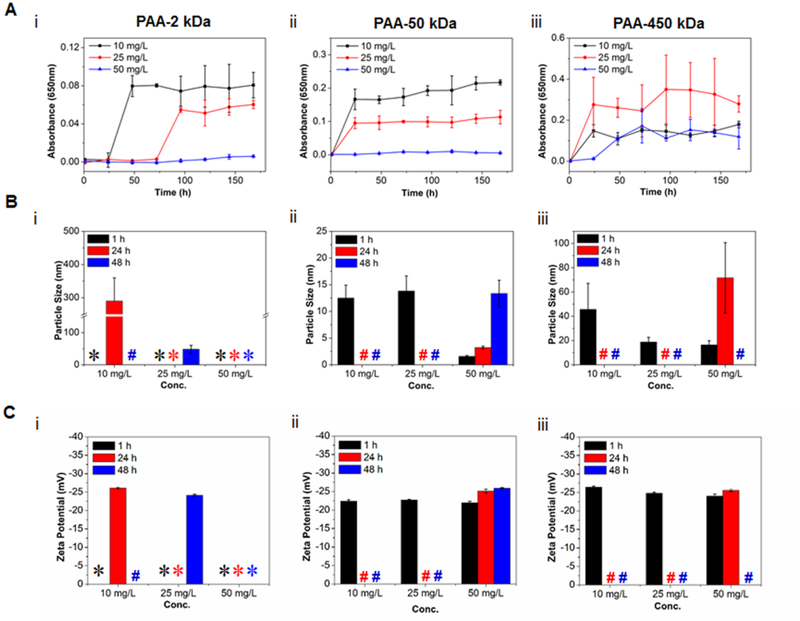
Figure 5:
(A) OD profiles of PAA-ACP solutions with 2k-Da (i), 50-kDa (ii) and 450-kDa (iii) PAA and different PAA concentrations. (B) Mean particle size and (C) mean charge of PAA-ACP particles in mineralizing solutions with 2k-Da (i), 50k-Da (ii) and 450k-Da (iii) PAA and different PAA concentrations after 1, 24 and 48 hour(s). *: Particles, if in solution, had sizes below the limit of detection (1 nm). #: Solutions with precipitated minerals.

