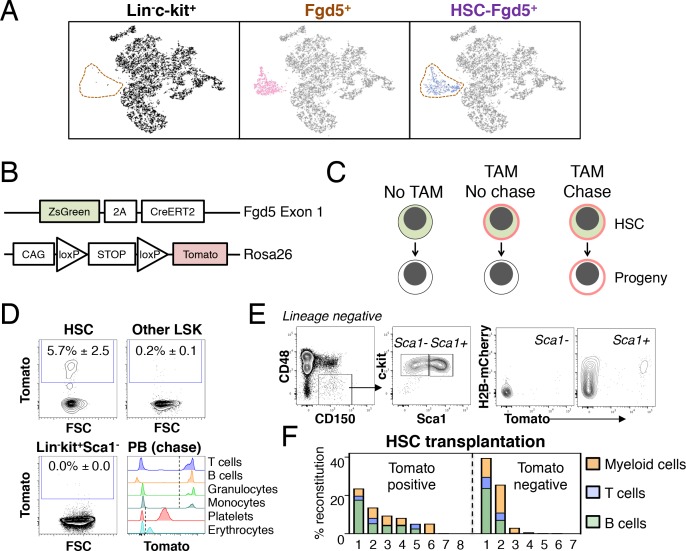
Figure 1. Fgd5-CreERT2 specifically labels HSCs and Fgd5-mediated label progresses throughout the hematopoietic system.
(A) Lineage negative c-kit+ cells (Lin-c-kit+, left), lineage negative c-kit+ Fgd5+ cells (Fgd5+, middle) and lineage negative Fgd5+c-kit+Sca-1+CD150+CD48- cells (HSC-Fgd5+, right) were isolated and subjected to single cell RNA-sequencing. The data was aggregated and visualized in a two-dimensional scatter plot after PCA and tSNE dimensionality reduction. Fgd5+ cells are highlighted in pink (middle), Lin-c-kit+ cells are highlighted in black (left plot) and HSC-Fgd5+ cells are highlighted in blue (right plot). The area that Fgd5+ cells occupy in relation to the transcriptomes of Lin-c-kit+ cells and HSC-Fgd5+ cells is marked by a dotted line (left and right plots). (B) Schematic representation of the Fgd5CreERT2/+; Rosa26lsl-Tomato/+ model. ZsGreen and CreERT2 are expressed from the Fgd5 locus and expression of a Tomato allele is driven by a CAG promoter from the Rosa26 locus and is preceded by a LoxP flanked STOP cassette. (C) Model description; HSCs selectively and continuously express ZsGreen in an Fgd5-dependent manner. Upon Tamoxifen (TAM) administration, HSCs express Tomato and expression of Tomato label is inherited by all progeny of Tomato-expressing HSCs. (D) Representative FACS plots showing Tomato label in BM HSPCs from Fgd5CreERT2/+; Rosa26lsl-Tomato/+ mice that were injected with Tamoxifen 48 hr prior to analysis. (D, lower right) Representative histograms depicting Tomato label in PB cells at various time points after the start of Tamoxifen administration from mice in Figure 3B (T cells 48 weeks, B cells 25 weeks, granulocytes and monocytes 8 weeks, platelets and erythrocytes 13 weeks). Numbers in FACS plots depict the mean % of Tomato labeled cells ± SD (n = 5) and dashed lines in histograms indicates the boundary for Tomato positivity. (E) FACS plots showing H2B-mCherry label retention and Tomato labeling in Lineage-c-kit+CD150+CD48- and Sca1+ or Sca1- cells from a representative mouse that had diluted H2B-mCherry label for 5 weeks and were injected with Tamoxifen 5 days prior to analysis (n = 3; 14–19 weeks old at analysis). (F) The fraction of donor-derived cells among different blood cell lineages was assessed in individual mice 16 weeks post-transplantation in recipients of 5 Tomato+ (n = 8) or 5 Tomato- (n = 7) HSCs. Abbreviations: 2A, 2A self-cleaving peptide; CAG, CAG promoter; loxP, LoxP site.


