Figure 4. Deprivation affects spatial frequency selectivity in V1.
V1 BOLD responses to all five of our band-pass noise stimuli (with peaks at 0.1, 0.2, 0.4, 1.1 and 2.7 cpd, see spectra in Figure 4—figure supplement 1); (A) response to stimuli in either eye, before deprivation; (B) response to stimuli in either eye, after deprivation. Responses are computed as medians across all V1 vertices (like in Figure 1D), averaged across subjects (error bars report s.e.m.). Continuous lines show the response of the best-fit population Spatial Frequency tuning (with the one parameter, the high spatial frequency cut-off, indicated in the legend), estimated by applying to the average V1 BOLD response the same model used to predict individual vertex responses (fitting procedure illustrated in Figure 5—figure supplement 1)..
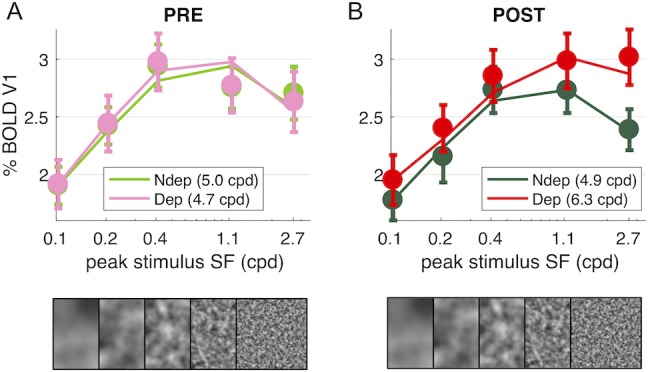
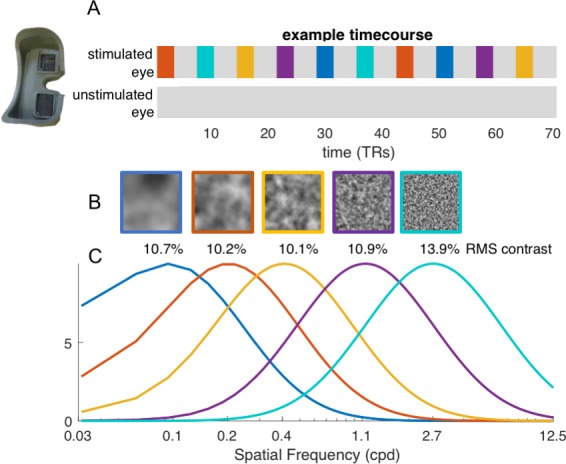
Figure 4—figure supplement 1. Bandpass noise stimuli.