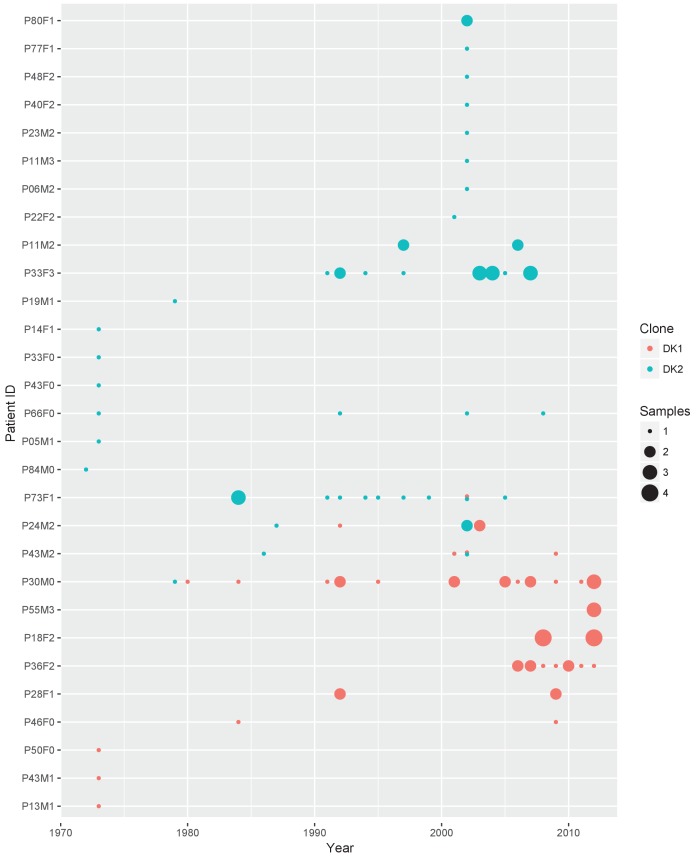
Appendix 1—figure 2. Sampling regimen for the transmissible clone types DK1 and DK2.
On the x-axis is sampling year and on the y-axis the patient ID. Red dots show DK1 and blue DK2. Dot size reflects the number of samples collected in a given year (1-4). Note that patient P36F2 from the children’s collection is included here as this patient harboured DK1 in addition to two other clone types (see also Appendix 1—figures 1 and 6). Created with ggplot2 in R (R Core Team, 2013; Wickham, 2016).

