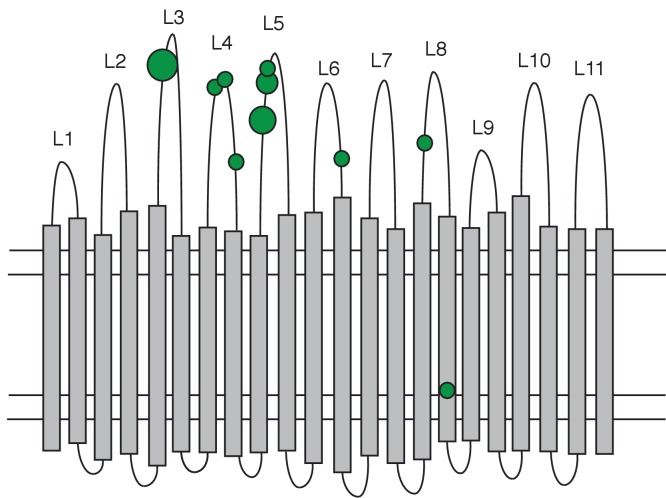
Figure 6. Distribution of non-synonymous mutations in the PhuR heme receptor.
The figure shows the β-barrel structure spanning the cell membrane (horizontal lines) with transmembrane strands (grey bars), extracellular loops (labelled L1-L11) and periplasmic turns (bottom loops). Green circles indicate the location of non-synonymous SNPs, the smallest circles denoting one mutation and the largest four. Mutations were significantly biased towards the extracellular loops.

