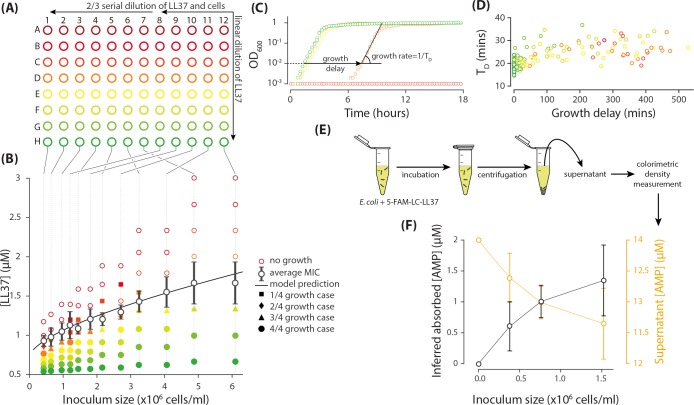
Figure 1. Measurement of the inoculum effect and peptide absorption by E. coli cells.
(A) A two-dimensional dilution scheme, which includes a linear dilution of LL37 peptides in columns 7 and 12 followed by two separate 2/3 dilution series of the cells and LL37 peptides on columns 12 to 8 and 7 to 1. (B) Each well represents a different combination of densities of LL37 peptides and E. coli cells from which we can extract the MIC as a function of inoculum size by monitoring growth of the culture in individual wells. The solid data points refer to the wells with growing culture and different marker symbols refer to the number of repeated trial outcomes that resulted in growing cultures. The empty data points refer to wells with no visible growth. A theoretical model developed later in this work nicely fits the average MIC. Data represent four biological repeats where the average and standard deviations of MIC are depicted with black symbols and lines. (C) The growth of the cultures were monitored by an automated plate reader in terms of OD600. Growing cultures reach a yield comparable to each other while non-growing cultures do not exhibit consistent increase in OD600. Data are examples from column 11 of Figure 1AB and they follow the same color coding. (D) Analysis of the growth in sub-MIC cultures reveal that growth is delayed depending on the LL37 concentration, but the doubling time of the cells shows no considerable change. Data are from the same experiments as in panel B and follow the same color coding as panels A and B. (E) Through colorimetric measurement of the concentration of a fluorescently tagged analogue of LL37 peptide (5-FAM-LC-LL37), we can quantify the amount of peptides remaining in the supernatant after incubation with E. coli cells. (F) The amount of 5-FAM-LC-LL37 peptides remaining in the supernatant decreases with inoculum size (the initial AMP concentration is 14 µM). The amount of absorbed AMPs by the cells are inferred by subtracting the final (supernatant) from the initial concentration of AMPs. The results are the average of 4 biological repeats. Average and standard deviations are depicted in the figure.


