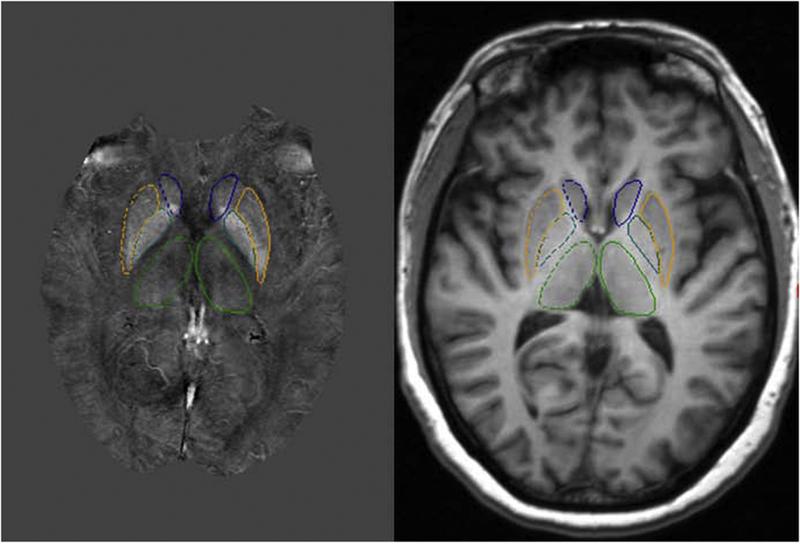
Fig 1. Representative images for brain iron measurement in a 66-year-old female control subject.

Left panel: showing regions of interest manually traced on quantitative susceptibility mapping of the subcortical gray matter nuclei. Right panel: showing corresponding 3D axial T1- weighted image at the same brain level as the left panel, indicating the anatomical reference of the subcortical gray matter nuclei. The subcortical gray matter nuclei included the following: caudate nucleus (blue), globus pallidus (green blue), putamen (orange) and thalamus (green).
