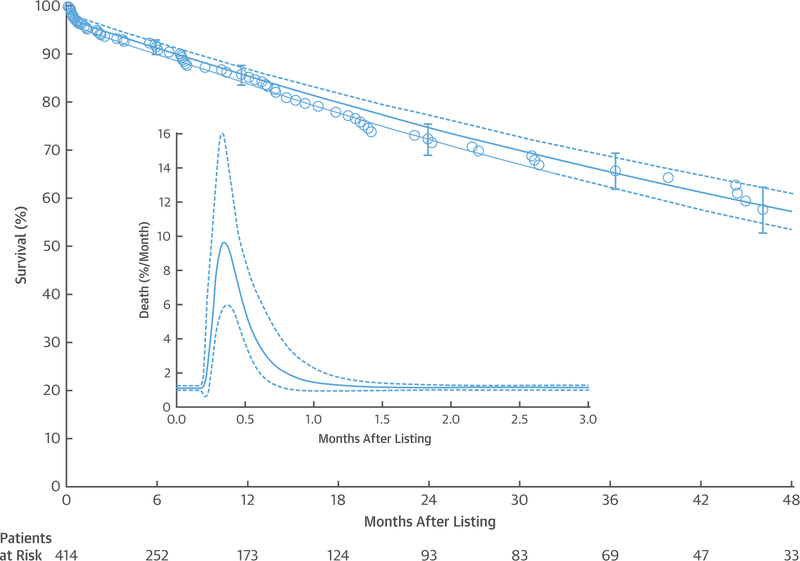
FIGURE 1. Overall Survival on the Heart Transplant Waitlist or After Insertion of a Durable Mechanical Circulatory Support Device as Bridge to Transplant Before Listing.
Each symbol represents a death positioned on the vertical axis by the Kaplan-Meier estimator; vertical bars are confidence limits equivalent to ±1 standard error. The solid line depicts parametric survival estimates enclosed within a dashed 68% confidence band equivalent to ±1 standard error. Numbers below the horizontal axis are patients remaining at risk. The inset shows an instantaneous risk of death (hazard function) on an expanded horizontal axis. The solid line depicts parametric estimates enclosed within a dashed 68% confidence band equivalent to ±1 standard error. Note the early peaking hazard and underlying constant hazard. Risk factors were simultaneously examined for each of these phases.

