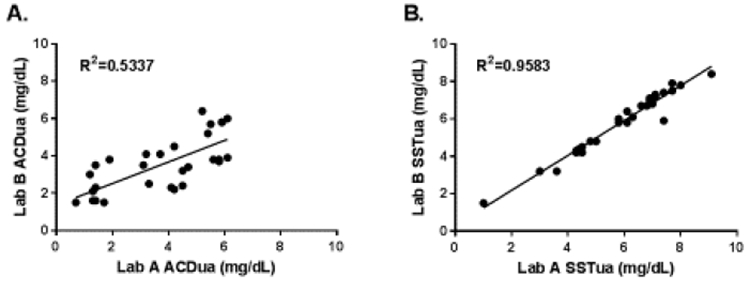
Figure 2. Comparison of UA concentrations measured by Lab A and Lab B using blood samples from healthy volunteers.

Pearson product-moment correlation was calculated to examine differences in UA concentrations measured by the two different laboratories. (A) Correlation of ACDua from the same blood sample measured by Lab A and Lab B (R2=0.5337, P<0.01). Mean percent difference between Lab A ACDua and Lab B ACDua was 38.5%. (B) Correlation of SSTua from the same blood sample measured by Lab A and Lab B (R2=0.9584, P<0.01). Mean percent difference between Lab A SSTua and Lab B SSTua was 4.9%.
