Figure 2.

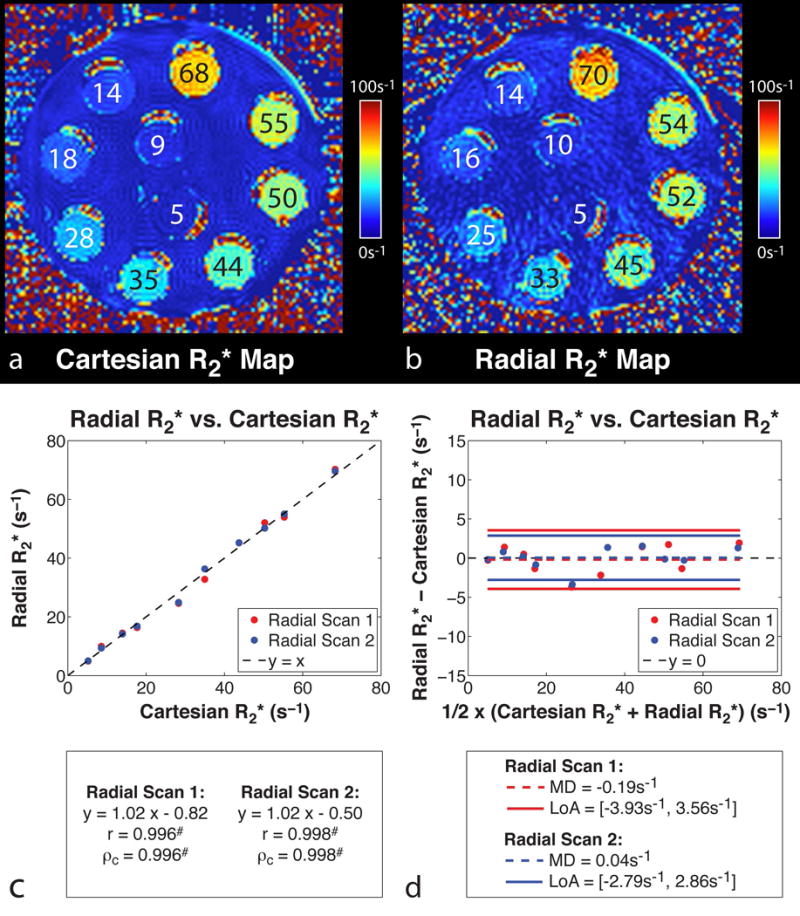
R2* maps of the ferumoxytol phantom acquired using the (a) Cartesian and (b) radial MRI sequences at 3 T in the axial orientation. Test tubes are labeled with their corresponding R2* values in s−1. R2* phantom (c) linear correlation and (d) Bland-Altman analysis results for radial R2* (scan 1) vs. Cartesian R2*, and radial R2* (scan 2) vs. Cartesian R2* at 3 T. #Statistically significant with P < 0.001.
