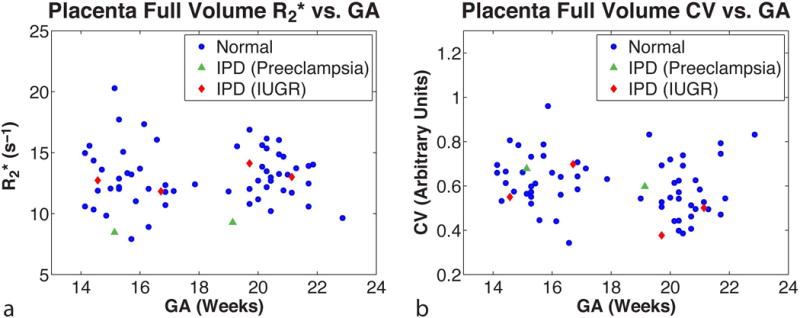
Figure 5.

In vivo placental R2* measured by free-breathing radial MRI at 3 T. The (a) mean placental R2* (s−1) and (b) coefficient of variation (CV) (arbitrary units) are plotted as a function of gestational age (GA) in weeks for the full placental volume. Normal pregnancies (N=30) are shown as blue filled-in circles. Abnormal pregnancies with ischemic placental disease (IPD) (N=3) are shown as green filled-in triangles for preeclampsia and red filled-in diamonds for intrauterine growth restriction (IUGR).
