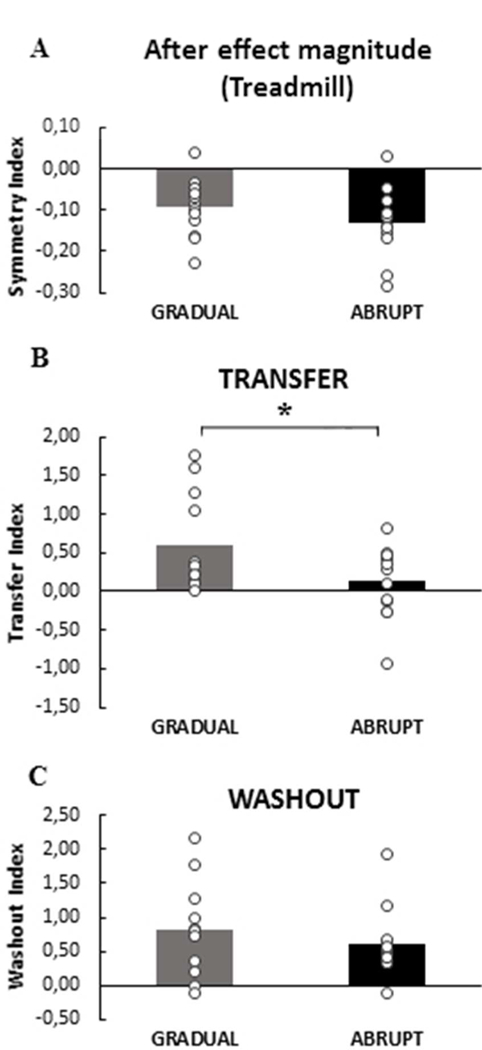
Figure 5.

Comparisons between groups Gradual (gray bars) and Abrupt (black bars) for step length symmetry. (A) The same magnitude of aftereffect (catch trial) on the treadmill was observed between groups. Note that the after effect is normalized by step length symmetry during treadmill baseline, therefore a zero value equals no difference compared to baseline. (B) The transfer index indicates the amount of adaptation transfer from the treadmill to over ground walking in each group. (C) Washout represents if the OG walking washed out the treadmill effects on locomotor learning. A greater value equals better transfer / washout. Note that no differences were observed between groups (p>0.05). Error bars indicate ± standard deviation. Asterisk indicates a significant difference between groups.
