Figure 5:
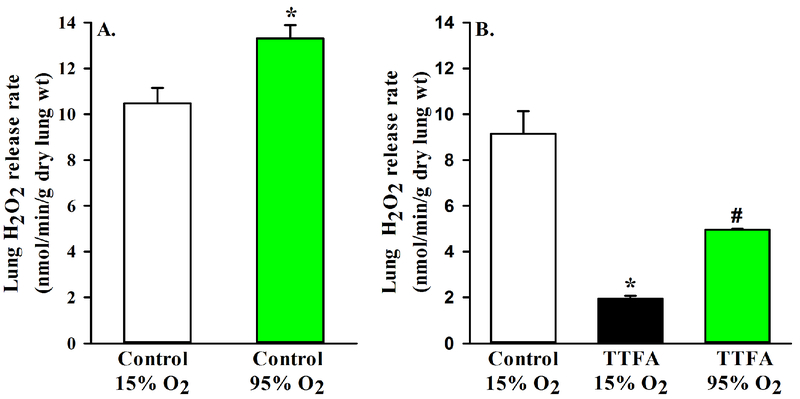
Panel A. Lung rates of H2O2 release during lung ventilation with normoxic (15% O2) or hyperoxic (95% O2) gas mixture (n =4). Panel B. Baseline lung rates of H2O2 release (control) along with rates in the presence of thenoyltrifluoroacetone (TTFA) during lung ventilation with normoxic (15% O2) or hyperoxic (95% O2) gas mixture (n = 4). Values are mean ± SEM. * significantly different from control (15% O2), # significantly different from TTFA (15% O2), paired t-test (p < 0.05).

