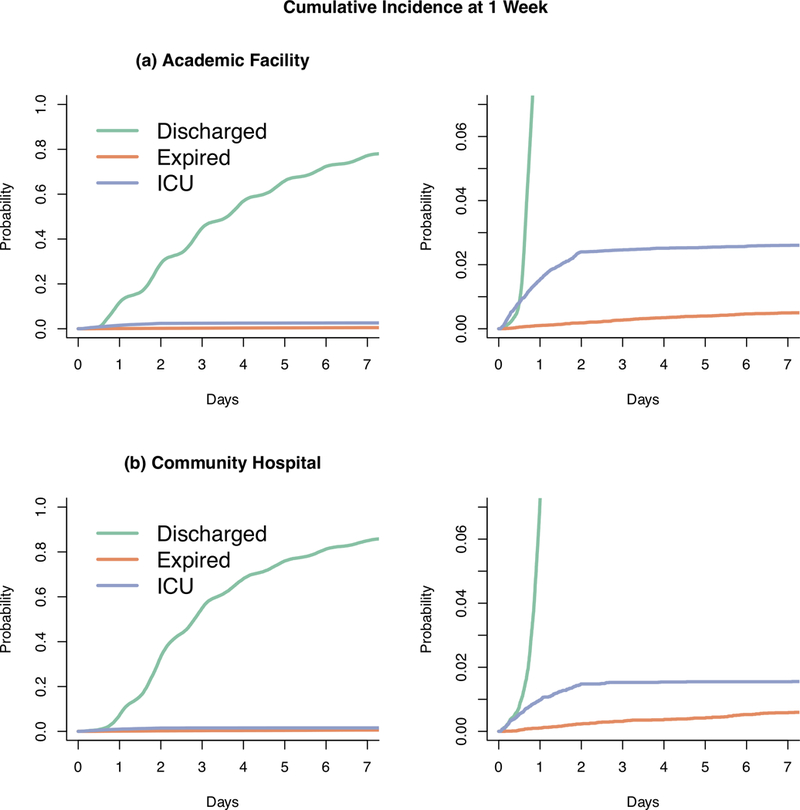
Figure 1:

Cumulative Incidence plot for time to each of the three possible outcomes: discharge, ICU transfer and death for the tertiary care (a) and referral hospital (b) respectively. The right side is a zoomed in version of the y-axis. Most adverse events happen within the first 2 days of admission. There were more adverse outcomes at the academic hospital.
