
Figure 3. Cell morphology and gene expression analysis of the heterozygous VUSMYL3(170C>A) iPSC-CMs.
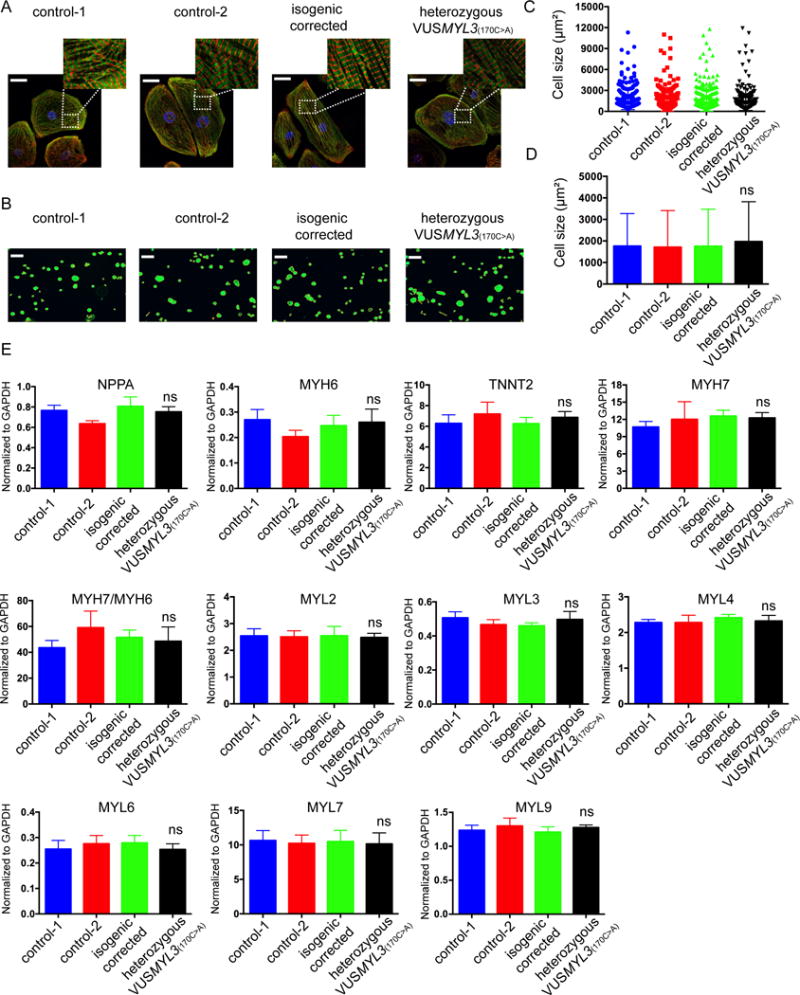
(A) Sarcomere immunostaining analysis of iPSC-CMs differentiated from the two healthy control, isogenic corrected, and heterozygous VUSMYL3(170C>A) lines, displaying sacromeric-α-actinin (red) and troponin T (green) stainings. Scale bars represents 10 μm. (B) A schematic representation of cell size measurements using Phalloidin. Scale bars represents 150 μm. (C) Distribution of iPSC-CMs size. (D) iPSC-CMs size statistical analysis (n≥200 cells per line). The heterozygous VUSMYL3(170C>A)-iPSC-CMs revealed no significant difference (ns) in average cell area compared with the tested iPSC-CM lines (healthy controls-1, healthy control-2 and isogenic corrected control), (E) Gene expression analysis of differentiated iPSC-CMs at day 45-50 dpd. The heterozygous VUSMYL3(170C>A)-iPSC-CMs revealed no significant difference in gene expression compared with the aforementioned tested iPSC-CM lines.