
Figure 5. Comprehensive assays for assessing the homozygous VUSMYL3(170C>A) and the heterozygous frameshift mutation MYL3(170C>A/fs) iPSC-CMs.
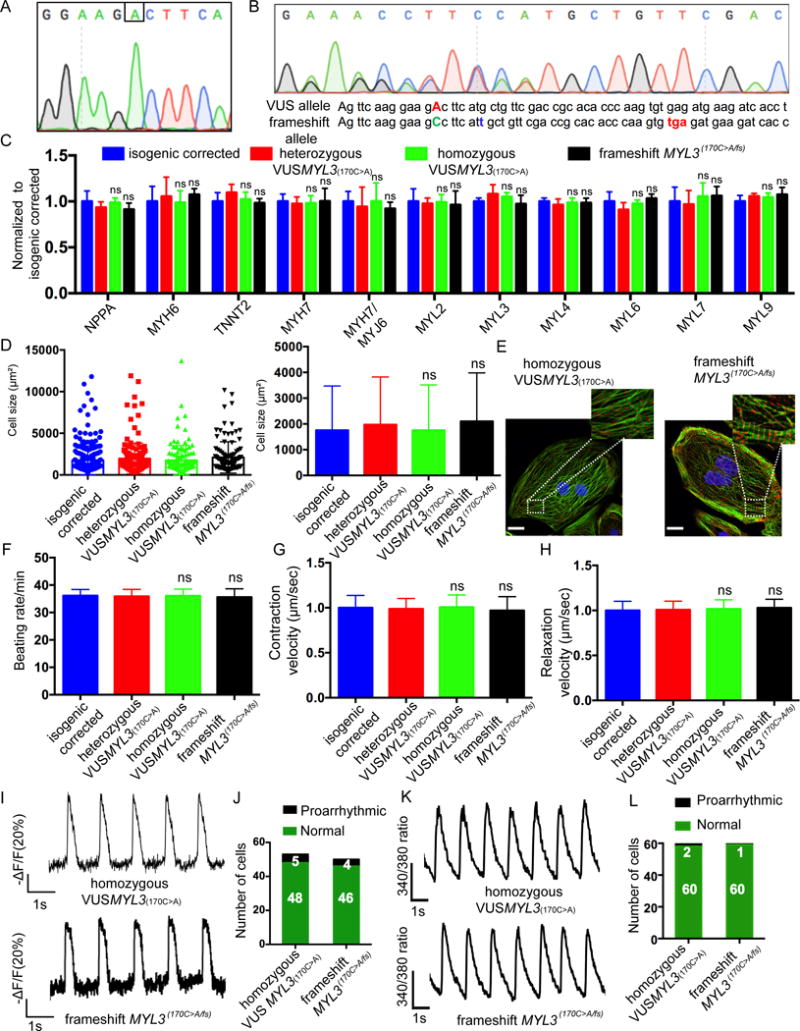
(A) Sanger sequencing confirmation of the isogenic homozygous VUSMYL3(170C>A) iPSC (clone1). Additional clones are presented in Supplemental Figure S6. (B) Sanger sequencing confirmation of the isogenic heterozygous frameshift mutation MYL3(170C>A/fs)-iPSC (clone1). Additional clones are presented in Supplemental Figure S6. The red capitalized ‘A’ represents the VUSMYL3(170C>A). The blue lower-case ‘t’ represents non-homologous end joining (NHEJ)-mediated 1bp insertion. The red lower-case letters (tga) display the premature stop codon. (C) Gene expression analysis. The homozygous VUSMYL3(170C>A)-iPSC-CMs and the frameshift mutation MYL3(170C>A/fs)-iPSC-CMs revealed no significant difference in gene expression compared with the isogenic corrected and the heterozygous VUSMYL3(170C>A) iPSC-CMs. (D) Cell size assessment (n≥200 cells per line). The homozygous VUSMYL3(170C>A)-iPSC-CMs and frameshift mutation MYL3(170C>A/fs)-iPSC-CMs revealed no significant difference (ns) in cell size distribution (left panel) and average cell area (right panel) compared with isogenic corrected and heterozygous VUSMYL3(170C>A). (E) Sarcomere immunostaining analysis displaying sacromeric-α-Actinin (red) and troponin T (green) stainings. Scale bars represents 10 μm. (F-H) Beating rate, contraction velocity, and relaxation velocity analysis, respectively. The homozygous VUSMYL3(170C>A) and frameshift mutation MYL3(170C>A/fs)-iPSC-CMs revealed no significant difference in beating rate, contraction velocity, and relaxation velocity, respectively, compared with isogenic corrected and heterozygous VUSMYL3(170C>A). (I) Representative action potential traces. (J) Number of iPSC-CMs displaying proarrhythmic activity. (K) Representative calcium transients. (L) Number of iPSC-CMs showing proarrhythmic calcium transients.