
Figure 6. Comprehensive assays for assessing the MYL3(170C>G) and MYBPC3(961G>A) iPSC-CMs.
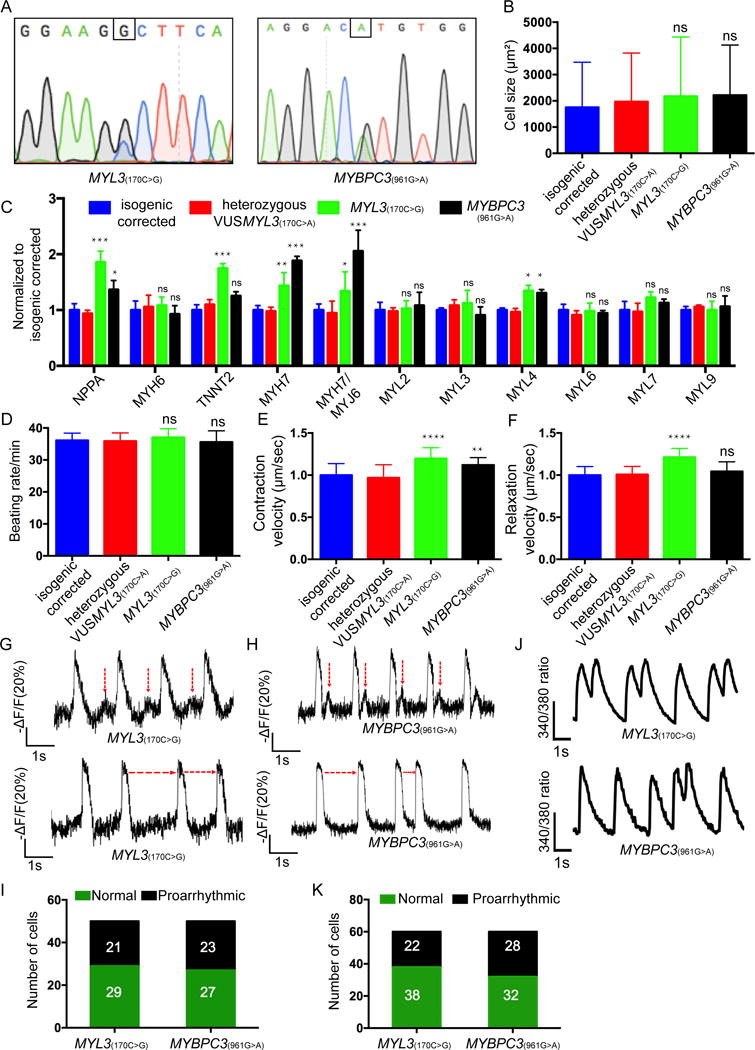
(A) Sanger sequencing confirmation of the isogenic MYL3(170C>G) clone1,(Additional clones are presented in Supplemental Figure S8) and MYBPC3(961G>A) iPSC line. (B) Cell size assessment (n≥200 cells per line) displayed as mean ± SD. The MYL3(170C>G) and MYBPC3(961G>A) iPSC-CMs revealed no significant difference (ns) in average cell area compared with isogenic corrected and heterozygous VUSMYL3(170C>A). (C) HCM-related gene expression analysis. The MYL3(170C>G) and MYBPC3(961G>A) iPSC-CMs revealed no significant difference in gene expression compared with the isogenic corrected and the heterozygous VUSMYL3(170C>A) iPSC-CM lines. (D-F) Beating rate, contraction velocity, and relaxation velocity, respectively. The MYL3(170C>G) and MYBPC3(961G>A) iPSC-CMs revealed no significant difference in beating rate, contraction velocity, and relaxation velocity, respectively, compared with isogenic corrected and heterozygous VUSMYL3(170C>A). (G-H) Representative action potentials traces displaying DADs (highlighted by red vertical arrows) and varying inter-beats intervals (indicated by red horizontal arrows) recorded from MYL3(170C>G) and MYBPC3(961G>A) iPSC-CMs, respectively. (I) Number of MYL3(170C>G) and MYBPC3(961G>A) iPSC-CMs displaying proarrythmic activity (J) Representative Ca2+ transients displaying DADs. (K) Number of MYL3(170C>G) and MYBPC3(961G>A) iPSC-CMs depicting proarrhythmic calcium transients. *p < 0.1, ** p < 0.01, *** p < 0.001, **** p < 0.0001, compared with isogenic corrected and heterozygous VUSMYL3(170C>A) lines.