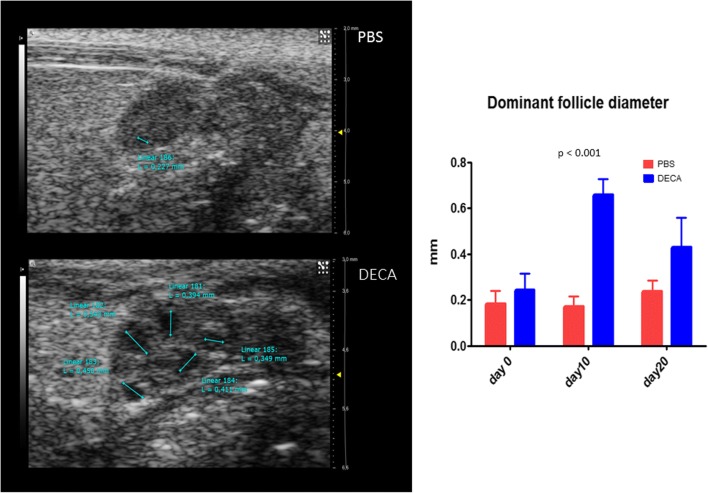
Fig. 3.
US images (arrows) show the increase in the diameter of the dominant follicle in a decapeptyl-treated mouse (DECA) compared with a control mouse, which received only phosphate-buffered saline (PBS). The graph shows the comparison between the dominant follicle diameter of PBS-treated mice and that of decapeptyl-treated mice

