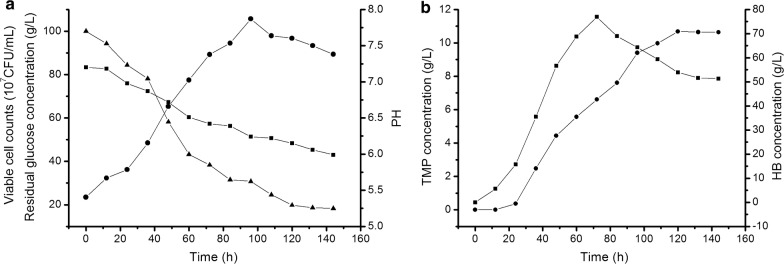
Fig. 7.
The fermentation process curve of LB5. Viable cells counts, residual glucose, PH value, the content of TMP and HB in the fermentation broth of LB5 were detected every 12 h a time till 144 h. a Black circle viable cells, black up-pointing triangle residual sugar content, black square PH value. b black square HB, black circle TMP

