Figure 5.

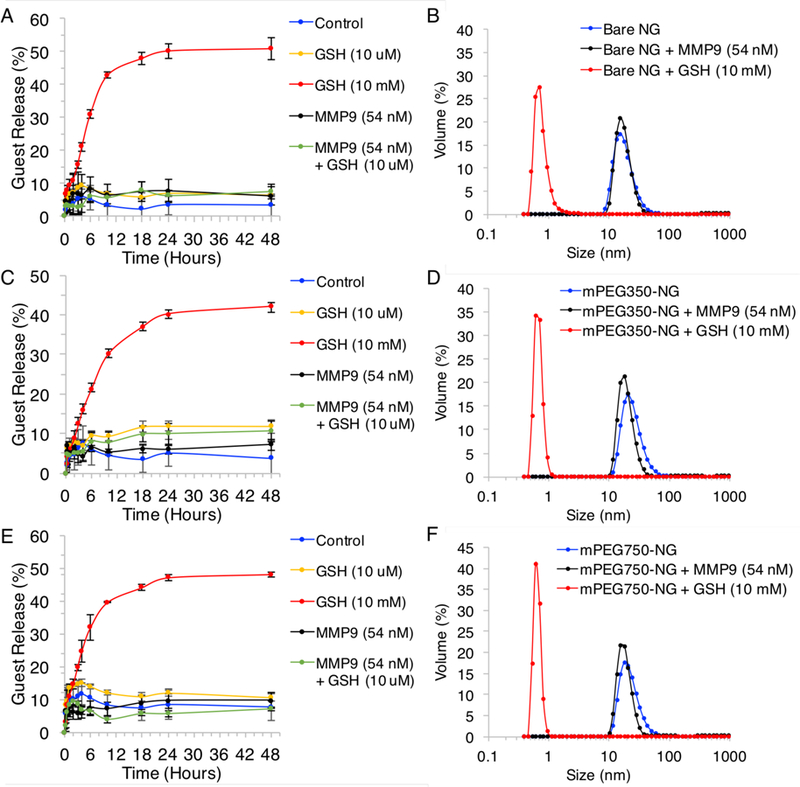
Guest release based on normalized fluorescence for nanogels A) Bare over 48 hours in response to GSH (10 mM and 10 µM), MMP-9 (54 nM), and MMP-9 (54 nM) + GSH (10 µm) compared to no stimulus control, and B) corresponding DLS of nanogel sizes upon exposure to MMP-9 (54 nM) and GSH (10 mM) and serial dilution. C) Guest release and D) DLS plots of mPEG350-NG upon exposure to stimuli, and E) guest release and F) DLS plots of mPEG750-NG upon exposure to stimuli.
